
Inside Day Trading Strategy – An Inside Day (Rules And Backtest Results)
Frequently you can hear about an inside day, especially in the stock market. What is an inside day in trading? Is an inside day profitable? Can you use inside days as trading signals and develop inside-day trading strategies? In this article, we explain what an inside day is and backtest several markets whether an inside day is profitable or not.
An inside day is defined by two bars where the last bar has all price action below yesterday’s high and above yesterday’s low. In other words, today’s price action and trading are completely inside yesterday’s. Our backtests indicate that an inside day is a poor trading signal and inside day trading strategies don’t work.
Let’s start by explaining what an inside day is:
What is an inside day trading strategy?
You need two bars to define an inside day. The reason for this is obvious when you learn that an inside day is when the low is higher than yesterday’s low and today’s high is lower than yesterday’s high. If both conditions are fulfilled, you have an inside day.
In other words, all price action of an inside day is inside the price action of yesterday. The whole range falls inside the range of yesterday. This chart of the oil futures reveals plenty of inside days (green arrows – ignore the red arrows):
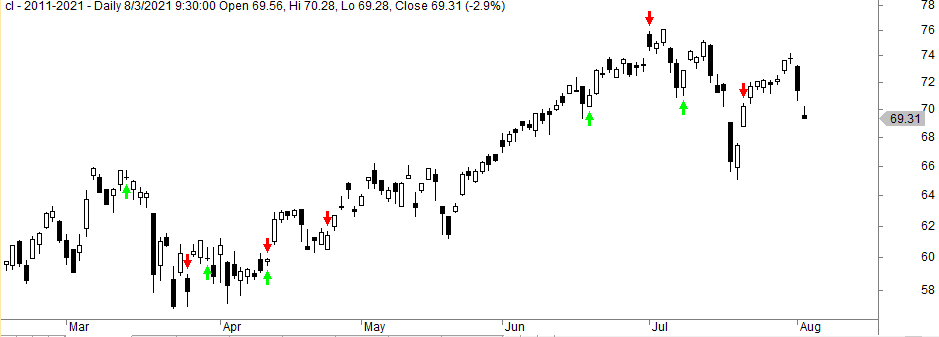
As you can see, the bars over the green arrows show an inside day and they are quite frequent, but it varies from market to market. It depends on the volatility and the price action between the close and the opening the next day. The above chart is crude oil and this market has many inside days.
Those asset classes susceptible to macro news show frequent inside days, like, for example, oil and gold. However, it depends on if you are looking at regular trading hours or the 23-hour electronic market. The chart above in oil shows the 0930-1600 market New York time. This time frame has of course more inside days than the 23-hour market.
An inside day can happen on intraday bars, daily bars, weekly bars, and whatever time frame in trading you are looking at. However, there are most inside days on daily bars, which is pretty logical. The reason is that you need overnight gaps and they happen the most on daily bars.
Inside day vs outside day
The opposite of an inside day is an outside day:
While the price action of an inside day is completely inside yesterday’s bar, an outside day has a higher high and a lower low – thus the price action has both a higher high and a lower low than yesterday.
The chart below illustrates the difference between an inside day and an outside day:
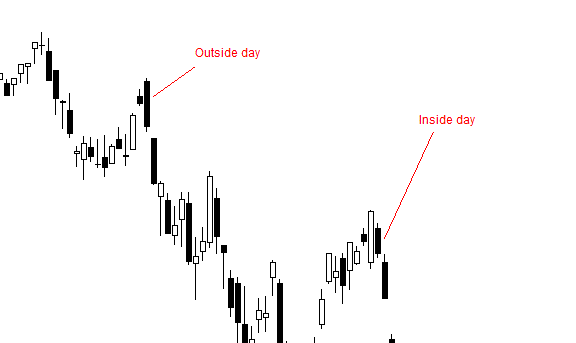
The chart above is based on candlesticks. In the world of candlesticks an inside day is called bullish or bearish inside day candle pattern (inside day candle strategy).
In previous articles, we have developed some trading strategies based on lower lows and higher highs:
What does an inside day indicate? Is an inside day bullish or bearish?
Unfortunately, an inside day doesn’t give you good odds in predicting the movement over the next coming days, according to our research and backtests. Most likely, you will not succeed by using inside days on its own, but by using it together with price action or indicators you improve the odds in developing a profitable inside day trading strategy. We get back to this in our backtests further below.
Some argue an inside day is bullish. It might be in stocks, but this also needs to be considered in relation to the upward bias in the stock market. One other factor could be if the inside day happens when it’s “oversold” or “overbought”.
Market commentators frequently argue inside days might indicate this or that, but all their hypotheses are, of course, untested. The only way to find out is by testing yourself!
How often does an inside day happen?
An inside day happens quite frequently. Here are some numbers on daily bars for a selection of markets:
- 611 in oil futures from 2000 until today
- 530 in gold futures from 2003 until today
- 513 in silver futures from 2002 until today
- 598 in S&P 500 futures from 2000 until today
There have been 779 inside days in the S&P 500 since 1993 (by using the ETF SPY), which is about 10% of the time. With such a frequency, it is unlikely to be very profitable on its own.
A word of caution: Be careful of using inside and outside days on ETFs like SPY. The reason is many wrong prints of the low and h