
Death Cross Trading Strategy: Statistics, Facts And Historical Backtests!
The Death Cross in trading is a widely cited phenomenon in the financial media. As of writing, the media is full of stories about the price of Bitcoin being close to the Death Cross. In this article, we look at the performance of the Death Cross in the S&P 500.
A Death Cross involves two moving averages – one short and one long, normally the 50 and 200-day moving averages. When the short moving average crosses below the long one, a Death Cross is formed. As a trading signal, it works reasonably well. Backtests reveal that the Death Cross signals short-term weakness, but in the long term, it also takes you out of many positions prematurely. If you sell when a Death Cross is formed and reenter when the opposite signal occurs, a Golden Cross, the returns are in line with the long-term averages, but you have less drawdowns (and pain?) along the way.
Let’s start by explaining in more detail what the Death Cross in trading is:
What is the Death Cross in trading?
A Death Cross involves two moving averages – one short and one long. When the short-term moving average descends below and crosses the long-term moving average, we have a Death Cross in trading.
Specifically, the moving averages used are mostly the 50-day and the 200-day averages. Thus, when the 50-day moving average breaks below the 200-day moving average a Death Cross has been formed. For some reason, this breakdown attracts a lot of media attention and a lot of speculation about a potential bear market. Is this for good reason? You’ll find out after our backtests further below.
Let’s show you how a Death Cross looks on a chart:
Death Cross example
Below is a visual example of a Death Cross in the cash index of the S&P 500:
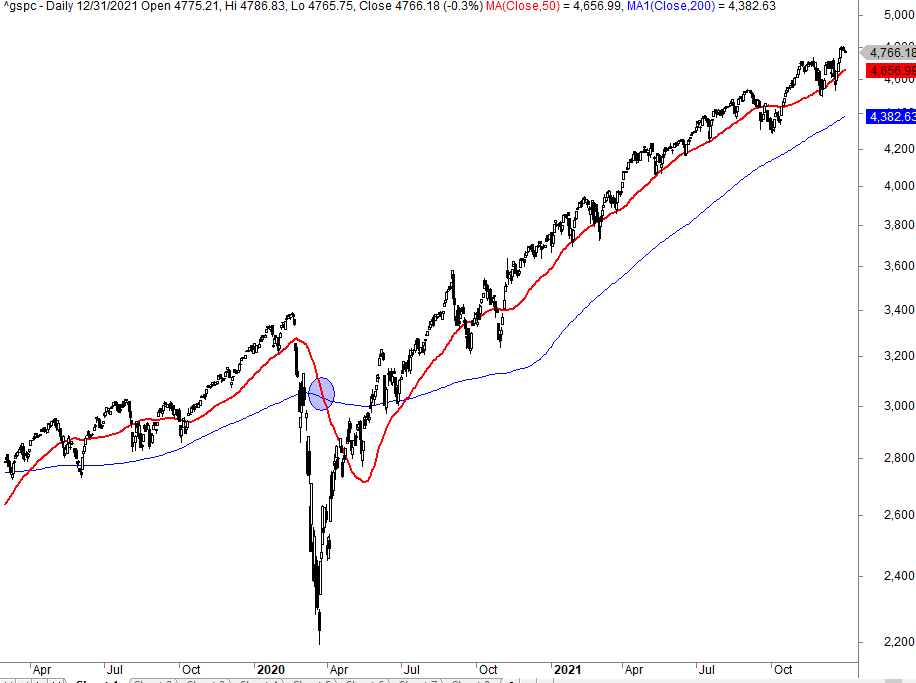
The red line is the short 50-day simple moving average while the blue line is the long 200-day simple moving average.
As you can see, in the midst of the Covid crisis in late March 2020 there was a Death Cross. Unfortunately, if you sold, you would hit more or less the exact bottom and be forced to reenter at much higher prices later. The S&P 500 doubled during the next two years!
Is Death Cross good or bad?
Most commentators speculate that a Death Cross signals potential lower prices ahead. However, a moving average only looks back and is a lagging indicator. There is only one way to find out if the Death Cross has any predictive value: we need to backtest and get a decent number of observations. Backtesting works and is a very valuable tool.
Many articles conclude the Death Cross has proven to be a pretty reliable indicator. Presumably, it has predicted some of the worst bear markets: 1929, 1938, 1974, and 2008.
However, it’s also relevant to know all the bull markets it has forced you to sell. The famous investor Peter Lynch said something like this:
Far more money has been lost by investors preparing for corrections, or trying to anticipate corrections, than has been lost in corrections themselves.
That said, we have great respect for what a simple tool like the 200-day moving average can do: it’s all about defense. A Death Cross might be just as useful as a defensive tool.
Paul Tudor Jones said the following about the 200-day average:
My metric for everything I look at is the 200-day moving average of closing prices. I’ve seen too many things go to zero, stocks and commodities. The whole trick in investing is: “How do I keep from losing everything?” If you use the 200-day moving average rule, then you get out. You play defense, and you get out.
He might be right. The low in 1933 was 90% lower than the peak in 1929! It’s of course devastating to lose 90% of the value of the assets. That’s one of the reasons why we want to diversify some assets into short-term