
Piotroski F-score
In 2000, Joseph Piotroski, a professor of accounting at Stanford in the United States, published a study where he disclosed his nine criteria for identifying quality stocks. The nine criteria are as follows:
- Positive return on assets (ROA) in the last financial year
- Positive cash flow from operations in the last financial year
- Higher return on assets in the last financial year compared to the previous year
- Cash flow from operations is higher than net income
- Lower debt-to-total assets ratio in the last financial year compared to the previous year
- A higher current ratio in the last financial year compared to the previous year
- No issue of shares during the last year
- Higher gross margins in the last financial year compared to the previous year
- Higher asset turnover in the last financial year compared to the previous year
Each item has a score of zero (if negative) or one (if positive). So, a company can get an F-score of nine if every one of the following conditions is met and an F-score of zero if all are not met.
Testing the F-score
Alpha Architect tested the F-score on stocks listed on the New York Stock Exchange from 1974 to December 2014. To avoid small-cap stocks, they only included stocks that fall into the top 40% of the largest stocks by market value.
Although they made a “new” F-score based on a few changes to the original Piotroski score, here’s the result with companies that scored at least 6 on the F-score:
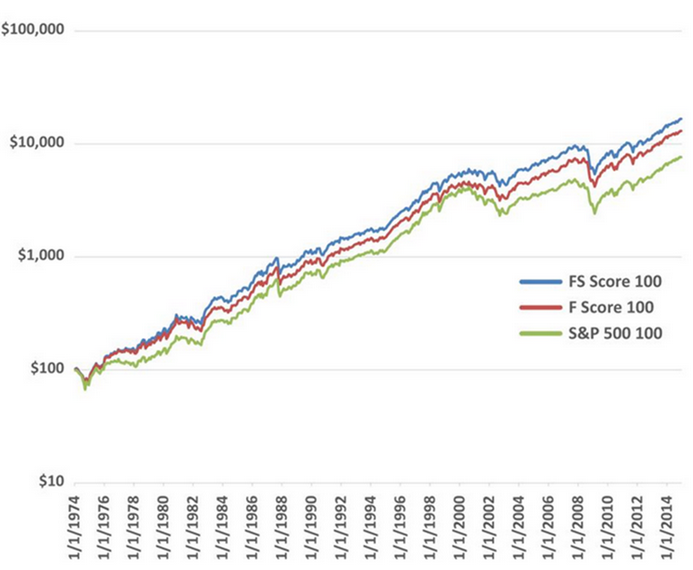
The top line is Alpha Architect’s version of the F-score, the one in the middle is the original Piotroski score, and the bottom line is for the S&P 500. Source: Alpha Architect:
The chart shows that the gap between the S&P 500 and the two F-scores gets bigger as the years go by. The FS score, which is Alpha Architect’s version of the F-score, gave a 13.3% annual return; the Piotroski score gave 12.6%; while the S&P 500 gave 11.2%.
However, the standard deviation for all portfolios was more or less the same.
Alpha Architect also tested the F-score on cheap stocks. But only the 20% cheapest shares with a Piotroski score higher than 6 were included in the portfolio. The result is demonstrated in the chart below:
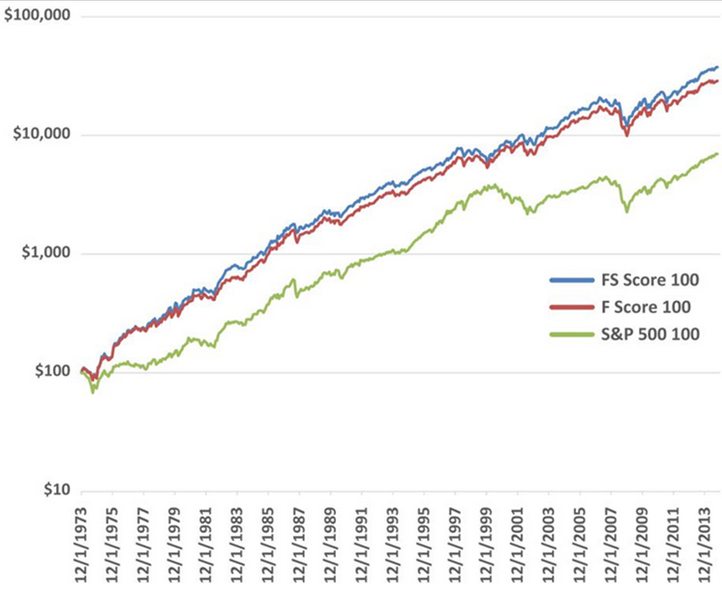
Source: Alpha Architect. https://alphaarchitect.com/2015/05/05/value-investing-research-simple-methods-to-improve-the-piotroski-f-score/
The annual return for Alpha Architect’s method was 15.9%; that of the Piotroski score was 15.2%; while that of the S&P 500 was 11.2%. The implication is that you can buy cheap stocks but only those that have solid balance sheets and accounts.
Just like Alpha Architect did on NYSE stocks, ValueSignals tested Piotroski scores on European stocks from June 1999 to 2011, but without sorting by value. The result can be seen in the table below:
| Q1 | Q2 | Q3 | Q4 | Q5 | |
| Small-cap | 205,1% | 36,7% | -6,6% | -41,9% | -55,0% |
| Mid-cap | 301,7% | 82,7% | 58,0% | 3,0% | -54,6% |
| Large-cap | 144,3% | 77,1% | 95,7% | 61,3% | 20,6% |
Similarly, Alexander Eriksen, in his master’s thesis, studied Piotroski’s score and its variations on Norwegian and Swedish stocks. The study period is from 1997 to the end of 2011 with one annual rebalancing of the portfolios.
Eriksen studied three different strategies: Piotroski’s method, a contrarian strategy, and a combination of Piotroski’s and contrarian stocks.
Within each of the three strategies, two equal portfolios were created, each with 10 stocks: a portfolio with assumed “good” stocks, and a portfolio with assumed “bad” stocks.
Eriksen’s results can be summarized as follows:
| ‘Good’ Piotroski | ‘Bad’ Piotroski | ‘Good’ Contrarian | ‘Bad’ Contrarian | ‘Good’ Combined method | ‘Bad’ Combined method | |
| Annual Return | 22,17% | -16,72% | 45,82% | -12,9% | 41,47% | -20,75% |
| Standard Deviation | 29,54% | 55,88% | 40,52% | 60,48% | 36,06% | 68,91% |
Conclusion
The most likely use of the Piotroski Score is as a filter. For example, if you want to buy “cheap” stocks, Piotroski might do a great job of separating the good from the bad.