
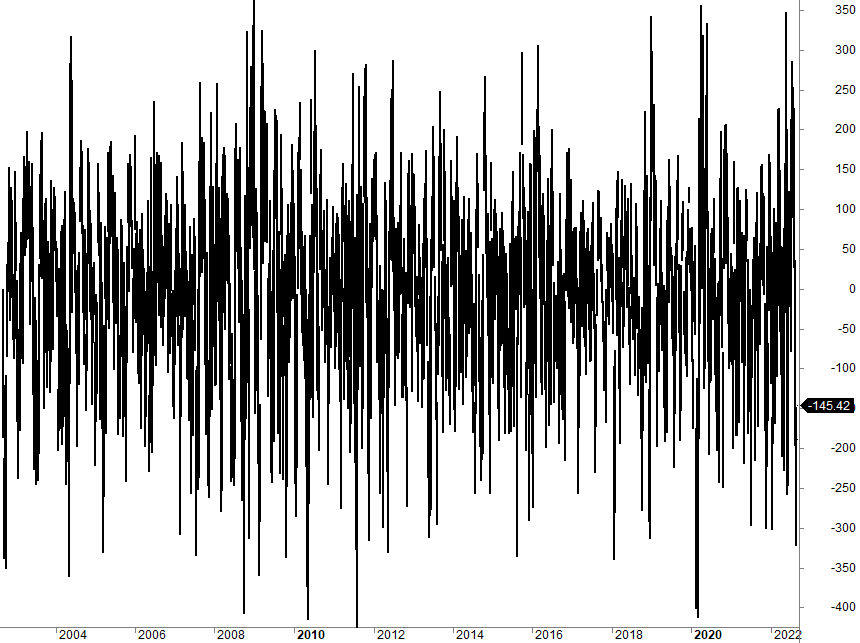
McClellan Oscillator and Summation Index: Trading Strategy and Backtest Analysis
Today, there are so many indicators used in technical analysis, but only a few are really valuable to retail investors and traders. These indicators are not just used for technical analysis of stock prices but are also used to get an idea of the sentiment in the equity market, helping you determine the number of equities closing higher relative to those closing lower in a particular index or stock market. The McClellan Oscillator and Summation Index are good examples of such tools.
The McClellan Oscillator is a market breadth indicator that is based on the difference between the advancing and declining stocks on an exchange, such as the Nasdaq Exchange, while the McClellan Summation Index is a market breadth indicator that is a cumulative index of the McClellan Oscillator. In other words, the McClellan Summation Index is a running total of the McClellan Oscillator values.
In this post, we will discuss the essential things you should know about the McClellan Oscillator and Summation Index.We end the article by backtesting a McClellan trading strategy.
Here are the things we will cover (a backtest at the end of the article):
What is the Nasdaq McClellan oscillator?
The McClellan Oscillator is a market breadth indicator that is based on the difference between the advancing and declining stocks. The indicator can be applied to any equity market. When applied to the Nasdaq market, we refer to it as the Nasdaq McClellan Oscillator. Financial analysts use it to monitor the equilibrium between rising and falling stocks on the Nasdaq exchange, which is dominated by tech stocks.
The indicator uses data from the stocks listed on the Nasdaq Exchange which are published in financial journals. The number of equities that closed higher or lower, commonly known as advances and declines, is noted in these periodicals. Those numbers are used to calculate the difference between the advances and declines, referred to as the daily market breadth, which is used to calculate the McClellan oscillator.
Once the daily breadth has been calculated at the end of the day, the data are smoothed using an exponential moving average (EMA). The EMA gives more weight to more recent data and less weight to older data in reverse sequence. This quantity is known as the smoothing constant. Most analysts use 19-period and 39-period EMA in calculating the oscillator. The value of the McClellan Oscillator corresponds to the difference in numbers between these two EMAs.
What is the Nasdaq McClellan Summation Index?
The McClellan Summation Index is the long-term version of the McClellan oscillator, which indicates market breadth based on stock gains and losses. The index is a running total of the McClellan oscillator.
The McClellan Summation Index was created by Sherman and Marian McClellan for tracking long-term trends and reversals. Although it is called a summation index, it is actually an oscillator that fluctuates above and below the zero line, and as such, signals can be derived from bullish/bearish divergences, directional movement, and centerline crossovers. A moving average may also be applied to identify upturns and downturns.
What does the McClellan summation index measure?
The McClellan Summation Index is utilized in technical analysis to determine bullish or bearish bias and the trend’s strength. It offers a way of assessing the sentiment of the market by checking whether the market is predominantly going up or down. Analysts see it as a different way of assessing the state of the market rather than checking the price movement of the composite index, such as the Nasdaq composite index.
Since the Summation Index is a direct derivative of the McClellan oscillator, it rises when the McClellan oscillator is positive and falls when the McClellan oscillator is negative. Thus, extended positive numbers in the McClellan Oscillator cause the Summation Index to trend higher. Conversely, extended negative readings cause the Summation Index to trend lower.
However, given its cumulative nature, the Summation Index is a slower version of the McClellan Oscillator — the index crosses the zero line fewer times, forms divergences less often, and produces fewer signals in general. In other words, while the McClellan Oscillator can be used for short-term and medium-term timing, the Summation Index is generally used for medium-term and long-term timing.
There are three basic signals:
- The Summation Index generally favors the bulls when positive and the bears when negative.
- It gives bullish and bearish divergences, which analysts can use to anticipate reversals.
- It can show directional movement, which can be used to define a bullish or bearish bias.
What does the McClellan Oscillator measure?
The McClellan Oscillator can be used to analyze different aspects of the market, but most analysts focus on three key areas:
- How money flows into the market: The oscillator can be used to monitor money entering and exiting the market. When the McClellan Oscillator is positive, it indicates more money is entering the market than the amount leaving it, and when it is negative, it shows more money is leaving the