
NAAIM Exposure Index Trading Strategy – Backtest
The NAAIM Exposure Index is becoming a popular indicator for tracking investor sentiment. But what is it about?
Compiled by the National Association of Active Investment Managers (NAAIM), the NAAIM Exposure Index represents the average exposure to US Equity markets reported by its members. The indicator line is a two-week moving average of the NAAIM managers’ responses. Our backtests indicate there are better indicators for contrarian trading strategies.
After we explain the NAIIM Exposure Index, we make some backtests to see how it performs as a contrarian trading indicator.
What is the NAAIM Exposure Index?
The National Association of Active Investment Managers (NAAIM) is an association of companies that specializes in the management of active funds in the United States. It surveys its members weekly concerning their firms’ overall equity exposure as of each Wednesday, and this is used to compute the NAAIM Exposure Index.
Thus, the NAAIM Exposure Index is an indicator that shows the average exposure to US Equity markets reported by members. The indicator line depicts a two-week moving average of the NAAIM managers’ responses.
Responses can vary widely. Here is a range of the responses:
- 200% Leveraged Short
- 100% Fully Short
- 0% (100% Cash or Hedged to Market Neutral)
- 100% Fully Invested
- 200% Leveraged Long
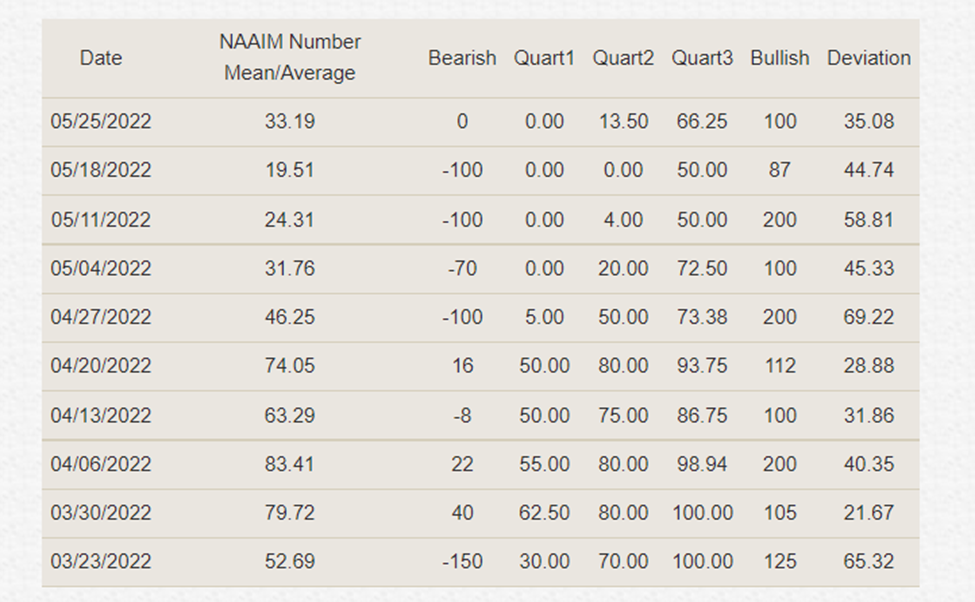
The responses are then tallied and averaged to provide the average long (or short) position of all NAAIM managers, as a group. See the table below:
Source: NAAIM.ORG
From the table above, you can see that for the week that ended on May 25, 2022, the NAAIM Exposure Index number was 33.19, while the preceding quarter’s average was 57.97.
What does the NAAIIM measure and capture?
The NAAIM Exposure Index is used to estimate investors’ sentiment in the U.S. stock market. Generally, high readings imply that investors (as represented by active investment managers) are quite bullish, and low readings suggest that investors are bearish. Thus, it might work as a contrarian indicator.
Even though these investment managers are professionals, they are still subject to crowd-like behavior and prone to trading biases. So, extreme bullishness could be a sign of a market top, while extreme bearishness could be a sign of a market bottom. Please see our backtest below for results.
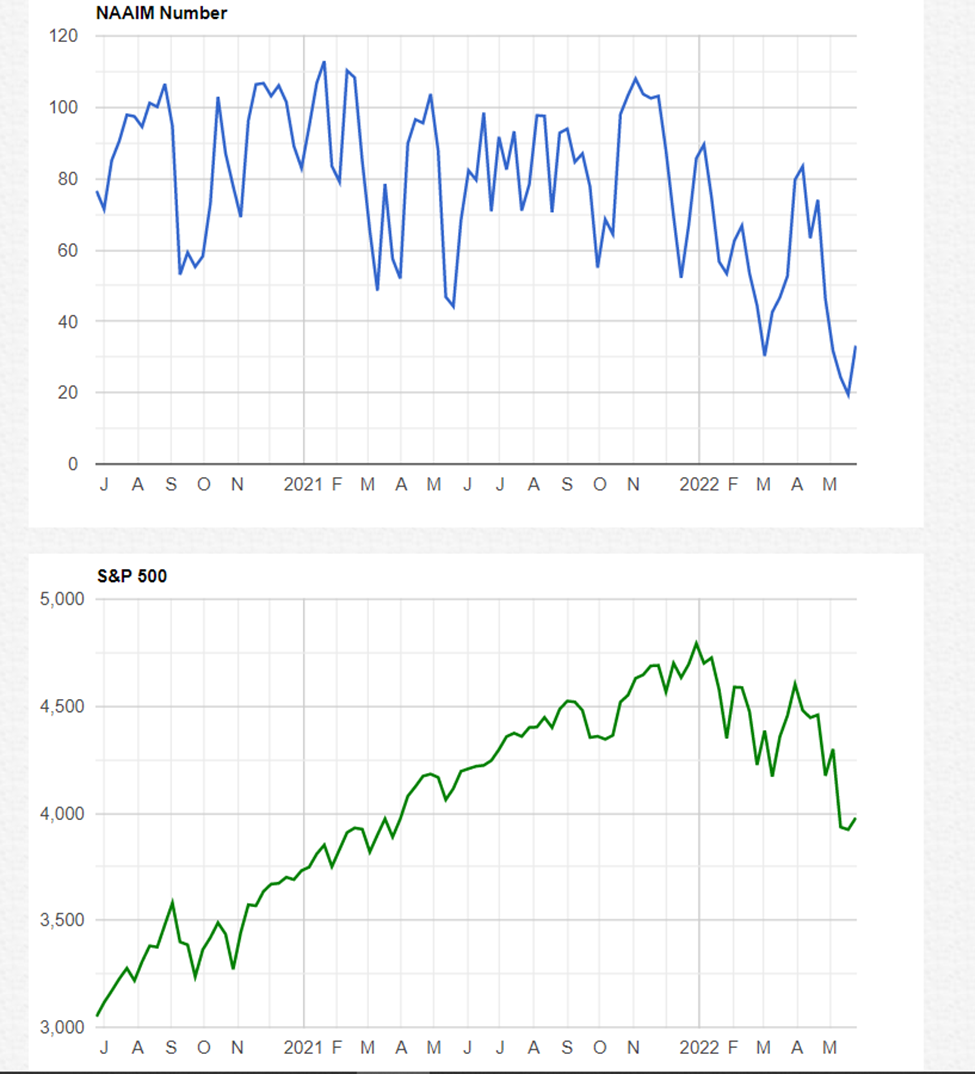
The green line shows the close of the S&P 500 Total Return Index on the survey date. The blue line depicts a two-week moving average of the NAAIM managers’ responses.
However, you should note that the NAAIM Exposure Index is not predictive in nature and is of little value in attempting to determine what the stock market will do in the future.
Primarily, the goal of most active managers is to manage the risk/reward relationship of the stock market and to stay in tune with what the market is doing at any given time. So, the NAAIM Exposure Index only provides insight into the actual adjustments active risk managers have made to client accounts over the past two weeks.