
On-Balance Volume Trading Strategy | Understanding the Setup, Rules, and Conducting a Backtest
Technical indicators offer powerful insights into what is happening in the market. While price is a factor in technical analysis, volume is as important as price as this tells traders the level of activity on a given security. The On-Balance Volume Trading Strategy is one of the most popular volume indicators. Let’s find out what it is.
The On-Balance Volume Trading Strategy (OBV) is a volume-based technical indicator that shows the buying and selling pressure in the market. It estimates the buying and selling pressure by adding volume on days when the market rallies and subtracting volume on days when the market closes lower. We end the article by making a backtest of on balance volume (OBV) (OBV trading strategy).
Related reading: –Volume trading strategy with backtest
What is the on-balance volume?
The on-balance volume is a trading indicator that is used to assess buying and selling pressure in the market. It shows the buying and selling pressure by adding volume on days when the market rallies and subtracting volume on days when the market closes lower. A market is said to have an up-volume only when the price closes higher. On the other hand, a down-volume happens when the market closes lower than its prior low close.
OBV will usually follow the market during an uptrend and keep on going higher as the price rallies — that is, both the price and the indicator move in the same way.
Similarly, in a downtrend, the OBV will make lower peaks and lower troughs, confirming that the current downtrend in the market is supported by volume.
The chart below is an example of how the indicator looks on SPY (the ETF for S&P 500):
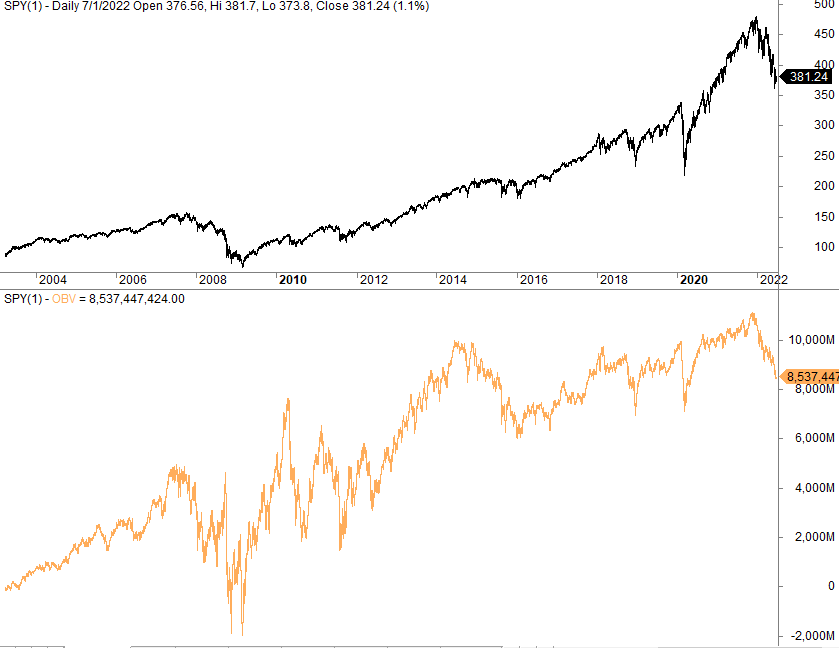
The lowest pane with the orange line shows OBV. It goes up and down depending on the intensity of the fall or rise coupled with the volume.
However, there are certain scenarios in the market when the OBV fails to react to price. The following are some of the scenarios that are likely to play out:
Non-confirmation of uptrend and downtrend
In this case, the price makes a new higher high but the OBV is unable to break above its previous high. This is often assumed an indication of weakness in the uptrend.
What this implies is that though prices were advancing and creating new highs, volume is unable to maintain the momentum. It means that volume does not support the price rise. This particular scenario can and does take place at the end of an uptrend.
In a downtrend, the market breaks below its prior low, but just like in the case of the uptrend, the OBV fails to break below its prior low as prices make new lows indicating that lesser volume is not supporting the downtrend. At this point, we know that the current downtrend is fading away, which signals the end of the downtrend. Unfortunately, this pattern is quite difficult to backtest.
Advanced breakout and breakdown
Price and volume rise together with each breaking its prior high. However, there are certain times when the price fails to break above a prior high and the on-balance volume breaks out to create a new high. The implication of this is that although price fails to breakout, volume on the other hand is significant enough to break above its recent highs. This shows that the price will soon break above its high. Unlike the non-confirmation of an uptrend that shows weakness, the advanced breakout shows strength and a trend conti