
Rate of Change Strategy (ROC Indicator And Backtest)
Traders often look for ways to measure the price momentum. The rate of change (ROC) is one of the most commonly used indicators for that. Let’s take a look at the indicator.
Often referred to as the momentum indicator, the rate of change (ROC) is a momentum-based technical indicator that compares the current price of a security to the price “n” period ago. It is plotted as an oscillator that moves above or below a zero-line as the momentum changes from positive to negative. Like other oscillators, the Rate of Change also has oversold/overbought levels that are adjusted according to the current market situation. At the end of the article we look at several ROC trading strategies.
What is the rate of change (ROC)?
The Rate of Change, which is also known as momentum, is a technical technical trading indicator that measures the momentum of price movements. It compares the current price of a security to the price “n” period ago. The indicator is plotted as an oscillator that moves above or below a zero-line as the momentum changes from positive to negative.
Like other oscillators, the Rate of Change also has oversold/overbought levels that are adjusted according to the current market situation. However, note that the market can remain at the oversold/overbought level for a prolonged period.
Here’s an example of how ROC looks on a chart:
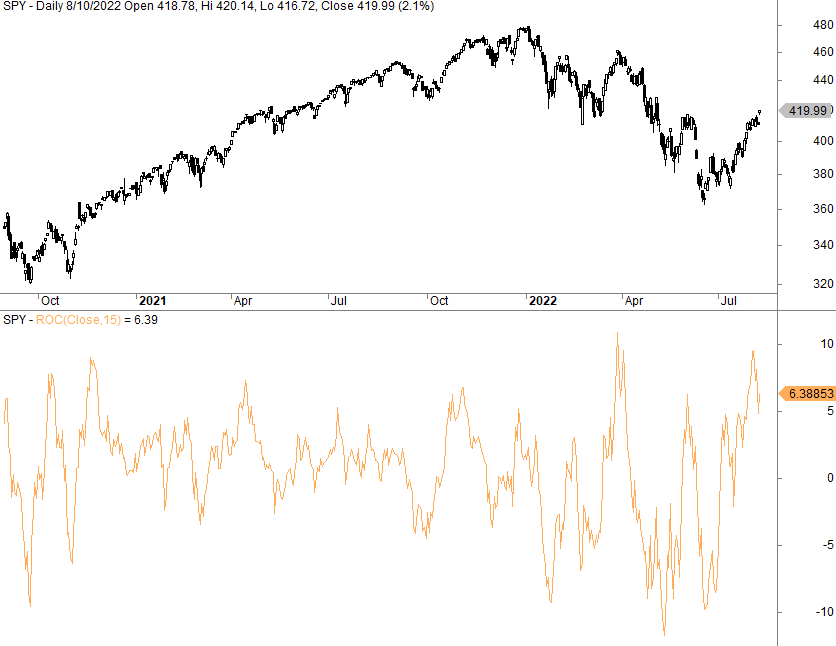
The chart above shows the 15-day ROC, and as you can see, it oscillates pretty heavily, perhaps expected in volatile financial markets.
Nonetheless, the rate of change is an important concept in finance as it allows the market to be seen through the lens of momentum and other forms of trend.
For instance, a security with a positive rate of change or high momentum is likely to outperform the broader market in the short term (1-6 months), while one with lower momentum is likely to underperform the broader market in the short term and is seen as a bearish signal to investors. By comparing the momentum of various stocks with one another or with the broad market index, such as the S&P 500, we get the idea of relative momentum, which has been used to create profitable trading strategies over the years.
The rate of change is widely used to measure the average change in the price of a security over time. This is called the price rat