

DeMarker Indicator Trading Strategy: Statistics, Facts And Historical Backtests!
Many trading indicators are available to traders. One of the indicators used in the stock market is the DeMarker indicator, named after Thomas DeMark, a prominent technical analyst. This indicator is a part of a trading system that incorporates bollinger bands.
The DeMarker indicator, also known as “DeM”, is a technical indicator that measures the demand for the underlying asset in the stock market. It is one of the many indicators used by traders to analyze market trends, along with bollinger bands and moving averages. Moving averages, a popular technical analysis tool, compare the most recent high and low prices to those of the previous period to determine trends and momentum. Bollinger bands are often used in conjunction with moving averages.
In this post, we take a look at technical indicators, a popular technical analysis tool that provides insights and signals on market trends. We will explore how to use this powerful tool effectively. We also make a backtest of the indicator.
What is the DeMarker indicator?
Also known as the DeM indicator, the DeMarker indicator is a popular technical trading tool used in the forex market. It measures the demand for the underlying asset and can be tested using a demo account. It compares the most recent high and low prices to those of the previous period to determine the direction of the trend and its momentum.
The DeMarker indicator is a forex trading signal and a member of the oscillator family of technical indicators. It can be used to identify high-risk buying (overbought) or selling (oversold) areas in a given market trend. Traders can also use the trading tool, the indicator line, to determine when to enter a market, or when to buy or sell an asset, and capitalize on probable imminent price trends and signals.
The trading tool was originally created with the market trend in mind, but you can apply it to any timeframe since it is based on relative price data. Designed to be a leading indicator in trading, this tool attempts to signal an imminent change in market price trend before it happens. Traders use the indicator line in trading, in combination with other signals, to determine price exhaustion, identify market tops and bottoms, and assess risk levels. The indicator demarker is an essential tool for understanding the trend.
DeMarker indicator graphic/chart example
Let’s show how the DeMarker indicator looks on a graph, providing signals for market price trading. Below is a ten-day DeMarker indicator:
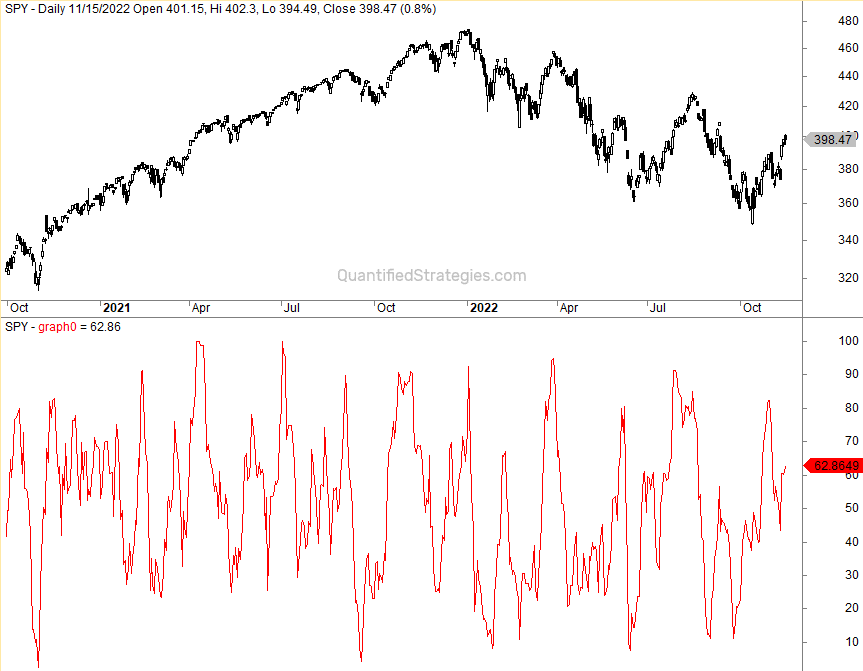
As you can see, it’s an oscillating indicator that goes from overbought to oversold levels in the trading market, providing signals for price movements.
DeMarker indicator formula
The DeMarker indicator is essential for understanding market trading. It functions similarly to the RSI indicator oscillator, but it diverges in that it does not focus on closing levels and instead focuses on price.
Instead, the DeMarker indicator focuses on understanding intra-period highs and lows in the trading market to determine price movements. The indicator line compares the price of the current bar on a chart to that of the previous bar. If the current bar has a higher high or a lower low than the previous bar, the indicator Demarker records a value. This is useful for trading purposes. On the other hand, if the current market has a lower high or a higher low than the previous bar, a value of zero is recorded for the price indicator demarker in trading.
These values are used in the market over a ‘look-back’ period (customarily 14 bars) for trading to get a numerator (DeMax) and denominator (the sum of the moving averages of DeMax and DeMin), which is then used to calculate the DeMarker value by dividing the numerator by the denominator.
Thus, the DeMarker indicator is a useful tool for trading in the market. It calculates the moving average of DeMax divided by the sum of the moving averages of DeMax and DeMin. The higher the value of the DeMax relative to DeMin, the greater the value of the DeMarker Indicator in the market for trading.
The formula for calculating DeMarker values in the trading market is given as follows.
DEM = SMA(DeMMAX) [SMA(DeMMAX) + SMA(DeMMIN)]
Where:
- DEM stands for DeMarker
- DeMMAX – records the difference between the current high and previous high over the number of X periods
- DeMMIN – records the difference between the current low and previous low over the number of X periods
The trading equation yields values bounded between 0 and 100 — values of the trading indicator above 70 are considered overbought territory, and values of the trading indicator below 30 are considered oversold territory. However, as always, no trading asset is the same and you need to backtest to find what is working and what is not working in the dem.
For your convenience, we have coded the DeMarker indicator in Amibroker. See the green banner further below in the article.
DeMarker indicator settings
Different platforms can set the indicator differently. But the default setting on most platforms is as follows for dem.
-
<