
Double Top Chart Pattern Trading Strategy: (Backtest & Example)
Chart patterns can help you understand the condition of the market. The double top pattern can warn you about a market peak, but do you know what it is and how to identify it?
The double top chart pattern trading strategy is a price action formation that consists of two swing highs that end around the same level. It is a reversal chart pattern seen at the end of an uptrend or a prolonged pullback in a downtrend. When completed, the pattern indicates that the price is likely to turn and head downwards.
In this post, we take a look at the double top pattern and at the end of the article, we give you a backtest of the double top chart pattern strategy.
What is a double top chart pattern?
The double top pattern is a price action formation that consists of two swing highs that end around the same level, and a swing low between them. It is a bearish reversal chart pattern seen at the end of an uptrend or a prolonged pullback in a downtrend. When completed, the pattern indicates that the price is likely to turn and head downwards.
With the two swing highs ending at roughly the same level, that level becomes a resistance level. A line joining the swing low to the preceding swing low constitutes a neckline, which serves as a support level. When the price breaks below the neckline, it shows that the uptrend might be over and the price is about to decline.
Being a bearish reversal chart pattern, traders see it as a warning sign that the uptrend might be over and as such, close their long positions. Short sellers might open short positions when the price breaks below the neckline.
Example of a double top chart pattern
Below is an example of a double top in Tradingview:
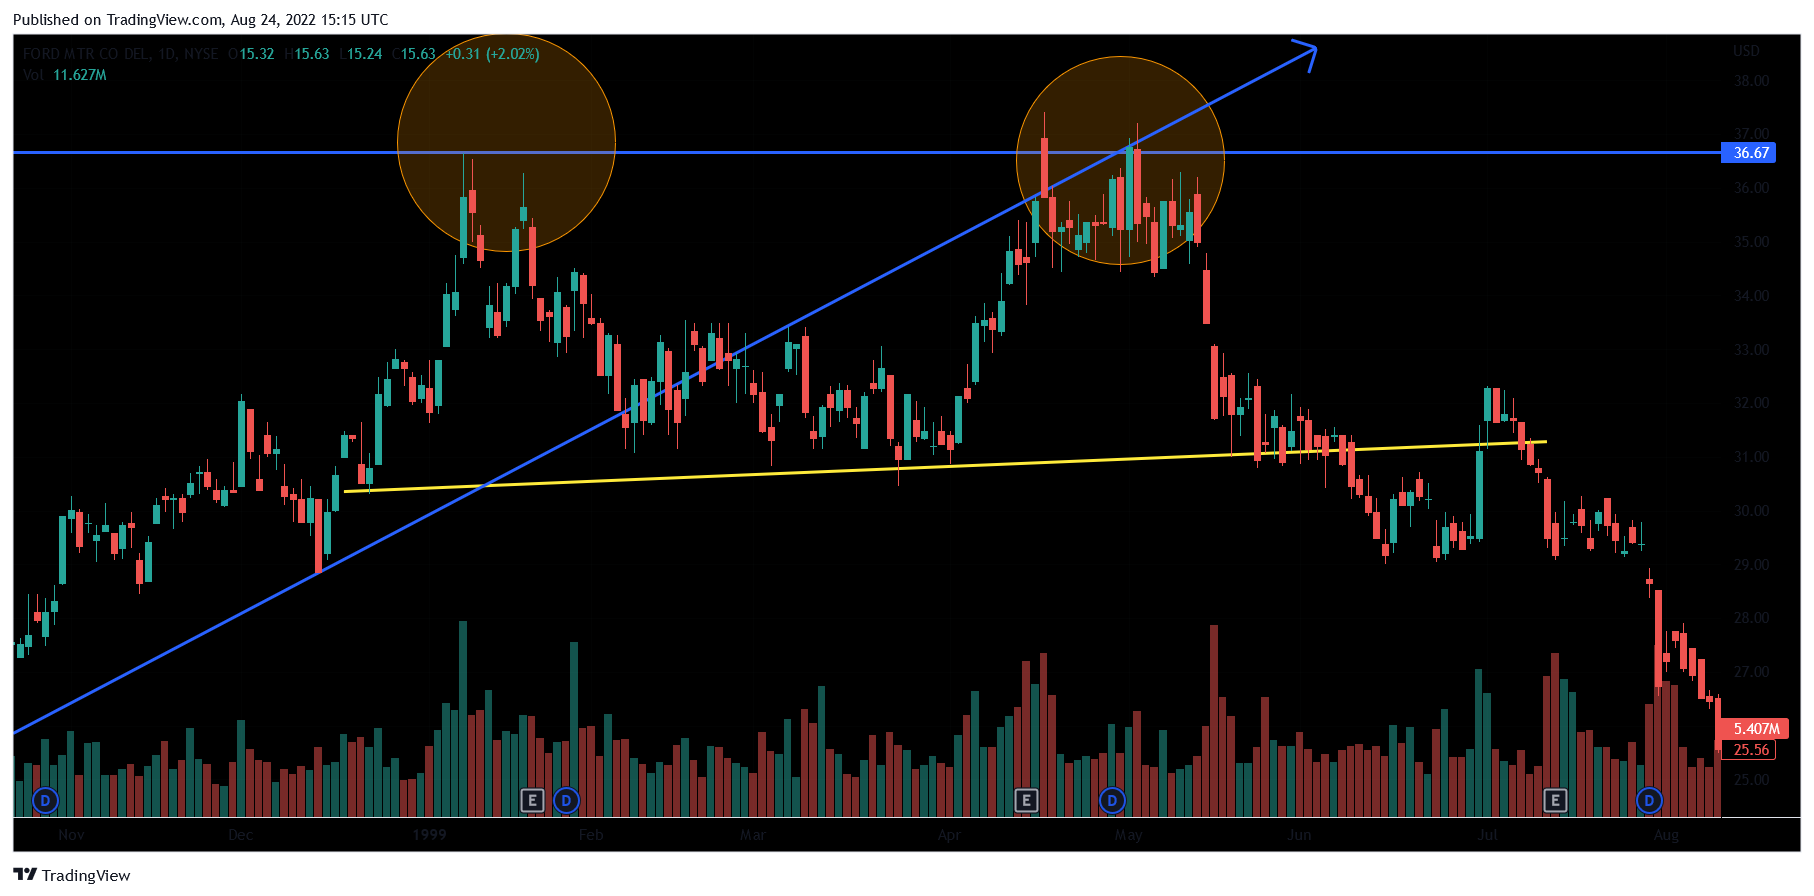
From the chart above, you can see that the price was in an uptrend, as indicated by the blue arrow trendline. The price reached a peak and pulled back to the neckline (yellow line), and then started to rally again. It got to the level of the first peak and was rejected twice before it eventually declined to the neckline and broke below it.
Is the double top pattern bullish or bearish?
The double top pattern is bearish. It is formed at the end of an uptrend and indicates a potential downward reversal, which is why it is considered a bearish reversal pattern.
How do you trade a double top pattern?
You can use the double top pattern as a warning to close a long position if you are a long-term investor. If you want to sell short, wait for the price to break below the neckline, and if you miss that opportunity, you can wait for a retest of the neckline, as you can see in the chart below: