
Elliott Wave Trading Strategy – Backtest And Examples
In this post, we take a look at the Elliot Wave trading strategy. At the end of the article, we present you with an Elliott Wave strategy.
In the 1920s and 1930s, stock market analyst, Ralph Nelson Elliott, discovered that the stock market, thought to behave in a somewhat chaotic manner, actually has a structure and follows a pattern. He then proposed what is now known as the Elliott Wave theory to explain his findings. So, what is the Elliot Wave theory?
The Elliot Wave theory is a technical analysis principle that states that the price of an asset moves in recognizable wave patterns. Regardless of the direction of the market trend, the waves are classified into two main types: the impulse waves (motive waves), which move in the direction of the trend, and the correction waves (retracements), which move opposite to the trend. These waves can be used to identify the possible direction of price movements in the future.
What is the Elliot Wave strategy (or theory)?
The Elliot Wave theory is a technical analysis principle that states that the price of an asset moves in recognizable wave patterns, which can be used to identify the possible direction of price movements in the future.
Elliot discovered the patterns after studying 75 years’ worth of stock data. Although he released the theory in the 1920s, it gained popularity in 1935 when Elliott made an uncanny prediction of a stock market bottom. The theory has since become an essential element of technical analysis.
In his explanations, Elliott described specific rules governing how to identify, predict, and use the wave patterns. Regardless of the direction of the market trend, the waves are classified into two main types: impulse waves (motive waves) and correction waves (retracements). The impulse waves move in the direction of the trend, while the correctional waves move in the opposite direction to the trend.
Understanding the structure of the impulse and corrective waves
There are specific rules for identifying the impulse and corrective waves.
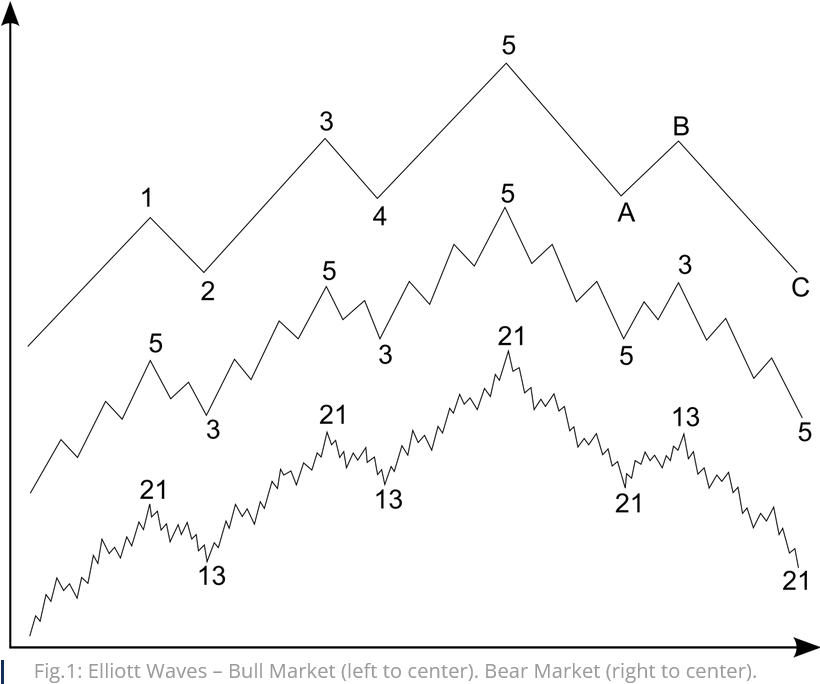
The impulse waves
Impulse waves consist of five sub-waves (labeled wave 1, wave 2, wave 3, wave 4, and wave 5) whose net movement is in the same direction as the trend of the market. Out of the five sub-waves, three of them are also motive waves (waves 1, 3, and 5), and two are corrective waves (waves 2 and 4). And, each of the sub-waves has its own sub-sub-waves, as you can see in the diagram above.
An impulse wave has three key rules that define its formation:
- Wave 2 can never retrace more than 100% of the first wave
- Wave 3 cannot be the shortest of waves 1, 3, and 5 (the motive sub-waves)
- Wave 4 shouldn’t go beyond the third wave at any time
The violation of any one of these rules invalidates the structure as an impulse wave, so the trader should relabel the waves.
Corrective waves
Corrective waves, which are the usual pullbacks or retracements in a trend, consist of three sub-waves that make net movement in the direction opposite to the trend. As the name implies, it is the price correcting itself after overshooting its mean value.
The corrective wave consists of three sub-waves — wave A (a motive wave in the pullback direction), wave B (a corrective wave in the direction of the main trend), and wave C (another motive wave in the pullback direction). Each of the sub-waves has its own corresponding sub-sub-waves. As with the motive wave, each sub-wave of the pullback never fully retraces the previous sub-wave.
What types of traders use the Elliott Wave theory?
Th