
Tape Reading Trading Strategy – Can It Be Done? Rules And Backtest
With the emergence of personal computers and online trading via electronic communication networks (ECNs), you may think of tape reading as something ancient. While the term brings up memories of trading legends like Jesse Livermore, it is worth noting that, tape reading is still a part of the toolkit of day traders and scalpers in today’s markets. But what is the tape reading trading strategy?
The tape reading trading strategy is a method of trading that is based on studying the market data presented in Level II quotes in the Time and Sales window. In the past, this strategy involved reading old-style ticker tapes transmitted over telegraph lines, which provided traders with market data (ticker symbol, price, and volume) — that’s where it got its name from. The strategy is mostly used by day traders and scalpers to spot and take advantage of short-lived shifts in demand and supply.

In this post, we take a look at the tape reading trading strategy, and we’ll also include a backtest at the end of the article.
Related reading:
- We have many short-term trading strategies and systems for sale, and
- We have even more short-term free trading strategies.
What does tape mean in trading?
In trading, tape refers to ticker tape, which describes the paper ribbon used in the late 19th and early 20th centuries for mechanically reporting and disseminating stock quotes and trades, made famous by the Jesse Livermore trading strategy.
Now present as an electronic representation of price quotes that appear in a linear fashion, providing investors with market information, ticker tape first appeared as a component of 19th-century ticker devices, which printed stock symbols and numeric data to convey information about trades and prices via telegraph wire.
The entries on the ticker tape include the stock symbol (which identifies the company whose stock has been traded), volume (the number of shares traded), the price per share at which the trade was executed, an up-or-down triangle indicating whether the price is higher or lower than the closing price of the previous trading day, and a second number indicating how much higher or lower the trade’s price was than the previous closing price.
Today’s electronic ticker tapes are color-coded, with green used to denote greater trade prices, red used to denote lower trading prices, and blue or white used to denote no change. Since 2001, trade prices are displayed in decimals rather than in fractions which were in use before then.
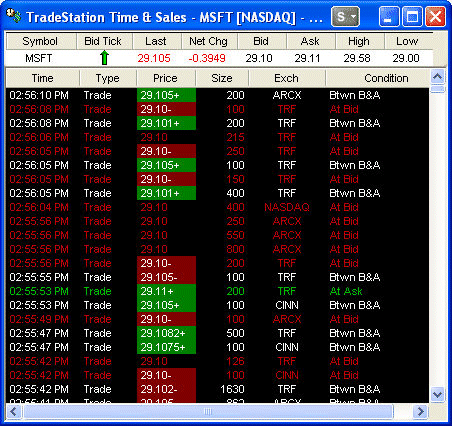
A more advanced form of the ticker tape in today’s market is the time and sales data, which provides a detailed account of a security’s or market’s trading activity. Although using the time and sales data is analogous to reading an old-fashioned ticker tape for an individual stock, the market data is now distributed as a real-time digital display that includes trade volume, price, direction, date, time, and exchange for each trade.
Most trading platforms have a well-labeled time and sales window, displaying real-time market data. The window shows a running table-format tally of trades for shares of a specific stock. Each of the primary components of time and sales, such as date/time, price/change, and volume, is organized in columns.
Rows of data are frequently color-coded to indicate whether the trade occurred on, within, or outside the bid or ask. Many trading platforms now allow investors to customize the display of time and sales data by adding price or volume filters, for example. Here is an example of a level 2 window:
What is tape reading (definition)?
Tape reading i