Weekly Trading Strategy – Backtest with Weekly Charts, Returns, and Performance Analysis
Most traders tend to focus on the daily and intraday charts. Only a few get to look at the weekly chart, let alone trade from them. But the weekly chart may provide more consistent setups that are easier to trade if you have the patients to wait for them. Want to know about weekly trading strategy?
The weekly trading strategy is a method of trading that focuses on the weekly price action. This can take any form: It could be positional trading based on the price action on the weekly chart or using the weekly chart to get a broader view of the market for a trend-following system on the daily chart, or even a weekly rotation system. It could also be a weekly swing trading strategy that focuses on capturing the price movement of the weekly price bars.
In this post, we take a look at the weekly trading strategy, and we’ll also make a backtest of a weekly strategy.
Related reading:
What does weekly trading strategy mean?
The weekly trading strategy is a method of trading that focuses on the weekly price action. This can take any form, such as these:
- Trading based on the weekly chart
- Using the weekly chart to get a broad view of the market
- Swing trading weekly price movements
- Weekly sector rotation between assets
We hope you get the idea. The logic behind using a weekly system is that it trades less frequently than on daily bars, and it also might offer bigger gains. It’s more of position trading than swing trading on daily bars.
Trading based on the weekly chart
When you hear a weekly trading strategy, the common thing that pops up in your head is long-term or position trading because the weekly chart is such a high time frame chart that should give long-term trade setups.
That is right; most who trade on the weekly chart are long-term position traders. But they trade in different ways. Some are trend followers, while the majority look for range-bound markets on the weekly chart.
In fact, range trading seems to work best on the weekly chart. At least, range trade setups are more common than trend-following setups. Many trend followers trade on the daily chart. Trading trend setups on the weekly chart would mean holding a trade for several years because trends on the weekly chart can last that long. It’s a bit closer to buy-and-hold investing.
Most position traders that look for 6-12 months trades on the weekly chart mostly trade range markets, and they look for their setups at the support and resistance levels of the range.
Using the weekly chart to get a broad view of the market
A good number of traders that use the weekly chart are those who use trend-following strategies on the daily chart but feel the need to get a broader view of the market structure. They use the weekly chart to check the position of their trade setups within the broad market structure.
Their primary focus is on the key support and resistance levels on the weekly chart, which can guide where they can safely enter the market. Those key weekly price levels are also used to know where to place stop loss orders and profit targets.
What looks like a trend on the daily timeframe could actually be a price swing in a range on a weekly timeframe. So, the trend follower, while trailing the trend on the daily timeframe, may want to anticipate the end of the trend at the weekly chart resistance if the market has been range-bound on the weekly chart.
Trading the weekly price bars
A not-so-common weekly trading strategy is trading the weekly price bars on a lower timeframe, such as the H4 timeframe. By the nature of its duration — often not more than a week — this type of trading can be classified as swing trading.
An example is trading the weekly bar highs and lows. The highs and lows of the weekly price bars can be important resistance and support levels on the lower timeframes. A trader can formulate a strategy to trade those levels on the H4 timeframe. The strategy can be a breakout of those levels or a reversal from there.
What are some weekly trading strategies?
There are different strategies you can create around the weekly chart, as we have mentioned above. Here, we will focus on a few of them:
Range trading
This strategy is all about trading a range-bound market on the weekly chart. It is actually the most common strategy among position traders, unlike what you may think — trend following. Most position traders hold their trades for about 6-12 months, and range setups on the weekly timeframe offer them just that.
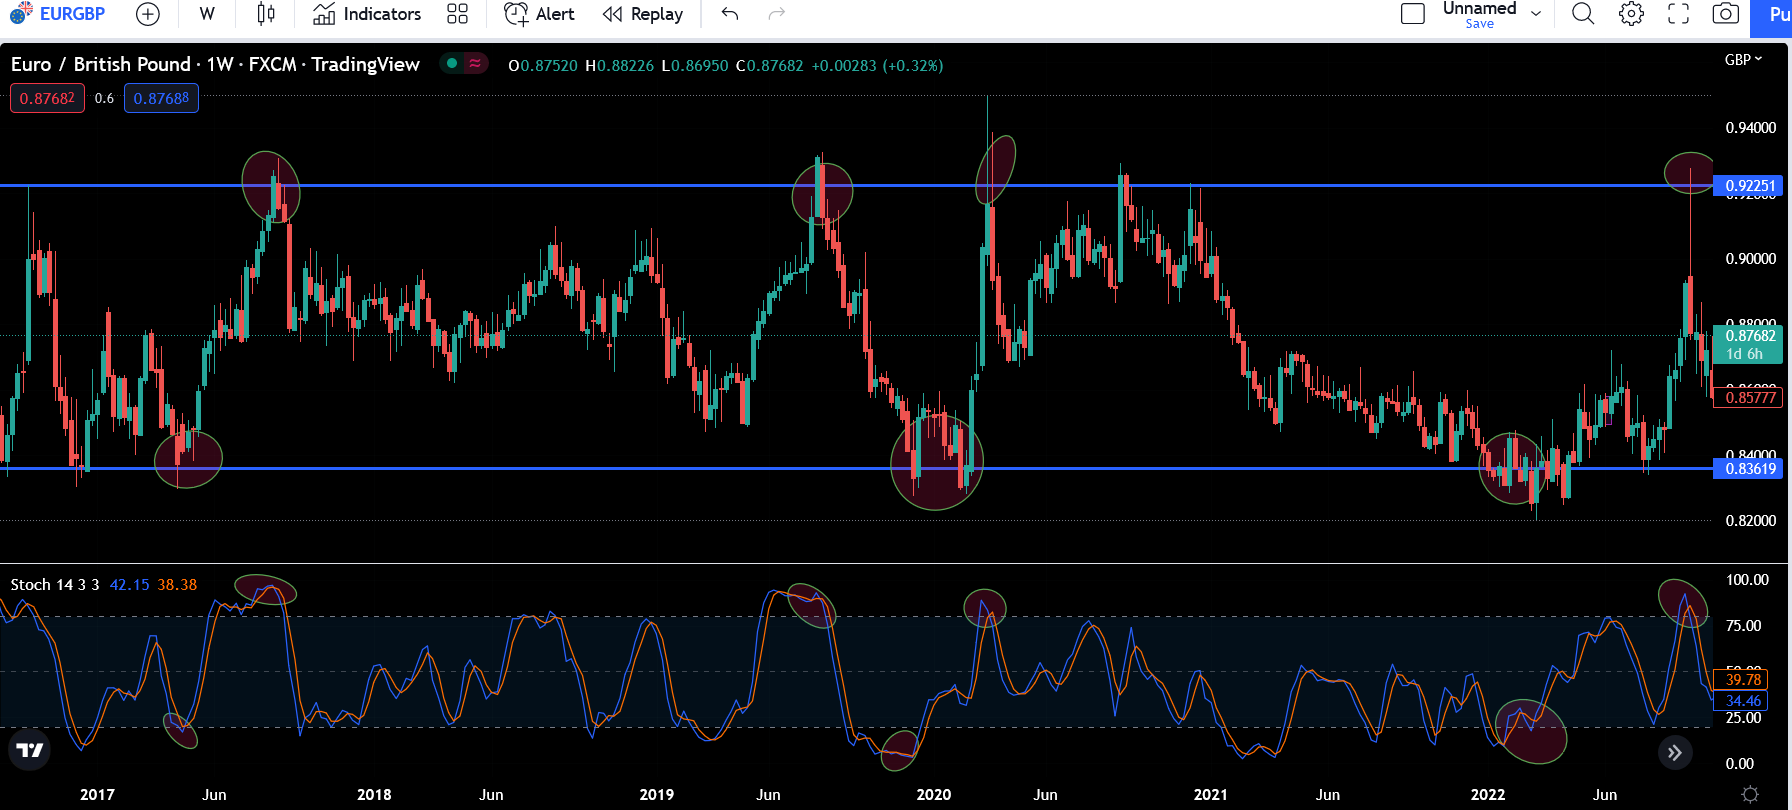
The first step in range trading on the weekly chart is to identify a range-bound market and mark the support and resistance levels of the range. Once you have done that, you look for trade setups when the price reaches either the support or the resistance level. The trade setup can be a price action pattern or an indicator signal. Common price action patterns you can use are reversal candlestick patterns, such as the hammer, shooting star, engulfing, or harami pattern. Common indicator signals are oscillator overbought/oversold signals or divergence signals.
Take a look at the chart below: