
Reversal Day Strategy – Backtest and Overview (Bullish Reversal-Market Turnaround)
Making wise investment decisions in today’s erratic financial market may depend on your ability to recognize the signals of a potential market reversal. The phrase “Reversal Day” refers to a day when a stock or market index changes direction, either upward or downward. What is the Reversal Day strategy?
This article will discuss the idea of a reversal day strategy, its potential causes, and the significance of identifying these signals in the stock market.
This post will offer helpful ideas on analyzing market movements and making wise judgments, whether you’re an experienced investor or just learning about the stock market. So let’s get started and learn more about Reversal Day before we make a backtest of the strategy.
What Is A Reversal Day?
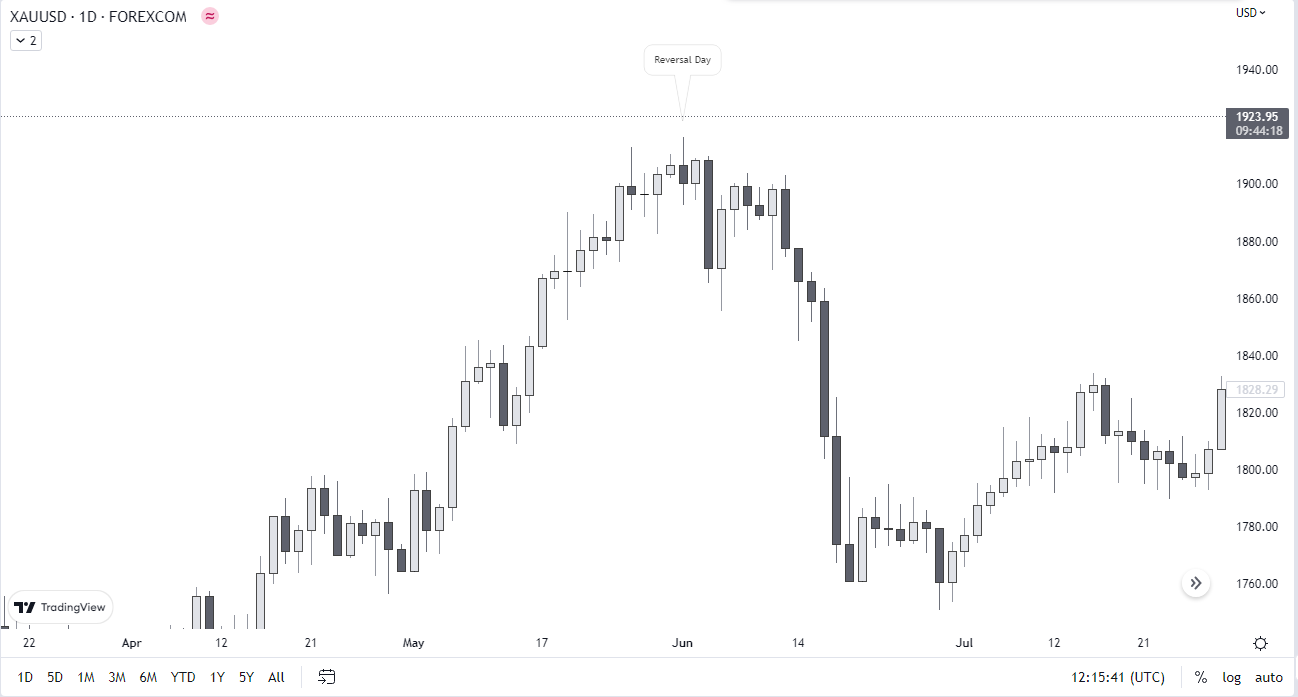
A stock or market index experiencing a substantial change in direction, either upward or downward, is referred to as having a “Reversal Day” This shift in trend can happen after an extended uptrend or downtrend, and it sometimes coincides with high volume in the market. Traders and investors often see Reversal Days as a crucial signal of impending market reversals.
Reversal Days, also known as Blowoffs or Selling Climaxes, come in various forms, each with distinctive qualities.
For instance, a “Bullish Reversal Day” or Selling Climax happens when a stock or market index moves upward after an extended downtrend. A new low that is lower than the previous day might characterize the day, but the day eventually ends Bullish, closing above the previous day’s high.
This is sometimes interpreted as a signal of a future market turnaround and might be positive news for investors and traders. This is the theory referred to in most articles and books. Is it correct? We backtested it further down in the article.
A “Bearish Reversal Day,” or blowoff, on the other hand, happens when a stock or market index significantly declines following a prolonged rally. The day might be characterized by a new high that is higher than the previous day, but the day eventually ends bearish and closes below the previous day’s low.
This is frequently interpreted as a signal of a potential market decline and is a warning sign for investors. Again, this is the theory, and we backtest this exact pattern later in the article.
Bullish reversal video
What Causes A Reversal In Stocks?
Several different factors can cause a reversal in stocks. Some of the most common include changes in market sentiment, economic conditions, and company-specific news.
One of the primary drivers of a stock reversal is a change in market sentiment. Market sentiment refers to the overall attitude or feeling of investors towards a particular stock or market.
When sentiment is bullish, investors are optimistic and tend to buy stocks, which can drive prices up. On the other hand, when sentiment is bearish, investors are pessimistic and tend to sell stocks, which can drive prices down.
Economic conditions can also play a major role in stock reversals. For example, an unexpected change in interest rates, inflation, or gross domestic product (GDP) can cause a reversal in stock prices. Economic indicators such as unemployment rates, consumer confidence, and manufacturing activity can also impact the stock market and cause a reversal.
Company-specific news can also be a major driver of a reversal in stocks. For example, positive news, such as a company’s earnings beat or a new product launch, can cause a stock to rise. In contrast, negative news, such as a management shakeup or regulatory investigation, can cause a stock to fall.
Stock reversals can also happen due to technical analysis, which studies past market data, primarily price and volume, to identify patterns and make trading decisions. Technical analysts look for trends, chart patterns, and indicators to determine the future direction of prices, and this is where the Reversal Day pattern comes in.
Over the last 30 years, the stock market has been prone to mean reversions. This means that an overbought stock tends to perform weaker in the nearest days compared to a stock that is not overbought: