
Dragonfly Doji Candlestick Pattern Trading Strategy (Backtest)
Candlestick charts are used by traders for more efficient technical analysis due to the revealing patterns that often have predictive outcomes. The Dragonfly Doji is considered one of the most trustworthy of the various candlestick patterns. Let’s find out how this Dragonfly Doji Candlestick Pattern Trading Strategy works.
A Dragonfly Doji is a candlestick pattern that appears in technical analysis when there’s indecision between buyers and sellers in the market. It forms when the opening and closing prices are the same or very close, with a long lower wick below the body indicating there was significant selling pressure, but buyers managed to reverse that. Although considered an indecision pattern, the pattern may suggest a potential bullish reversal when it forms at a support level.
In this post, we take a look at the Dragonfly Doji candlestick pattern.
Dragonfly Doji Candlestick Trading Strategy
The Dragonfly Doji candlestick pattern is often used in a trading strategy as a potential signal of a trend reversal from bearish to bullish. Traders look for the pattern to appear after a pullback in an uptrend, as it indicates a shift in buying pressure and a potential end of the pullback.
When the Dragonfly Doji appears, traders may look to enter a long position, buying the security and holding until it reaches a target price. Some traders may also set a stop-loss order, to limit potential losses if the trend does not reverse as expected.
The Dragonfly Doji is just one price pattern, so it should be used in conjunction with other analysis methods and market context to make informed trading decisions. Some traders may look for confirmation of the potential price reversal through other technical indicators such as stochastic, RSI, and volume analysis. Different traders may have different approaches to using the Dragonfly Doji in their trading strategy.
If you want to incorporate this candlestick pattern in your trading, you need to develop a robust trading strategy in combination with other technical tools and indicators, such as trendlines, support levels, moving averages, and momentum oscillators.
What is a Dragonfly Doji?
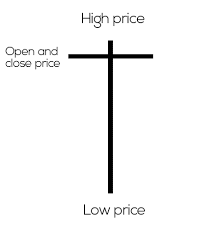
The Dragonfly Doji is a candlestick pattern that appears on a price chart, used in technical analysis of securities trading. It occurs when the open, high, and close prices are equal or nearly equal, creating a distinct “T” shape.
The pattern is considered a bullish reversal pattern and is formed when the opening and closing prices are the same or nearly the same, while the prices have traded significantly lower during the session. This creates a long lower shadow or “wick” on the candlestick and a small or non-existent upper shadow.
The pattern signals indecision between buyers and sellers, with the long lower shadow indicating that sellers pushed the price lower, but buyers eventually pushed the price back to close near the opening price. This suggests that buying pressure may be stronger than selling pressure, which could lead to a trend reversal.
However, it is important to note that the Dragonfly Doji is not a guarantee of a trend reversal, so one should use multiple technical indicators and other forms of analysis methods to confirm any potential signals. In fact, the context of the market and other price patterns should also be considered before making a trading decision. The pattern is more significant if it occurs as a part of the morning doji star pattern or the bullish tristar pattern.
How to Identify a Dragonfly Doji
A Dragonfly Doji is a candlestick pattern that can be identified on a price chart in technical analysis. To identify a Dragonfly Doji, you should look for the following characteristics:
- A single candlestick with a small or no real body at the upper end: The small body indicates that the opening and closing prices are around the same level, indicating indecision between buyers and sellers
- Long lower shadow: The key feature of the Dragonfly Doji is a long lower shadow or “wick” that suggests significant selling pressure that was reversed during the session.
- Small or non-existent upper shadow: The upper shadow or “wick” should be small or non-existent, indicating limited buying pressure.
- Formed at the end of a price swing down: The Dragonfly Doji pattern is significant only when it forms within a downswing, so it could signal a potential upward reversal.
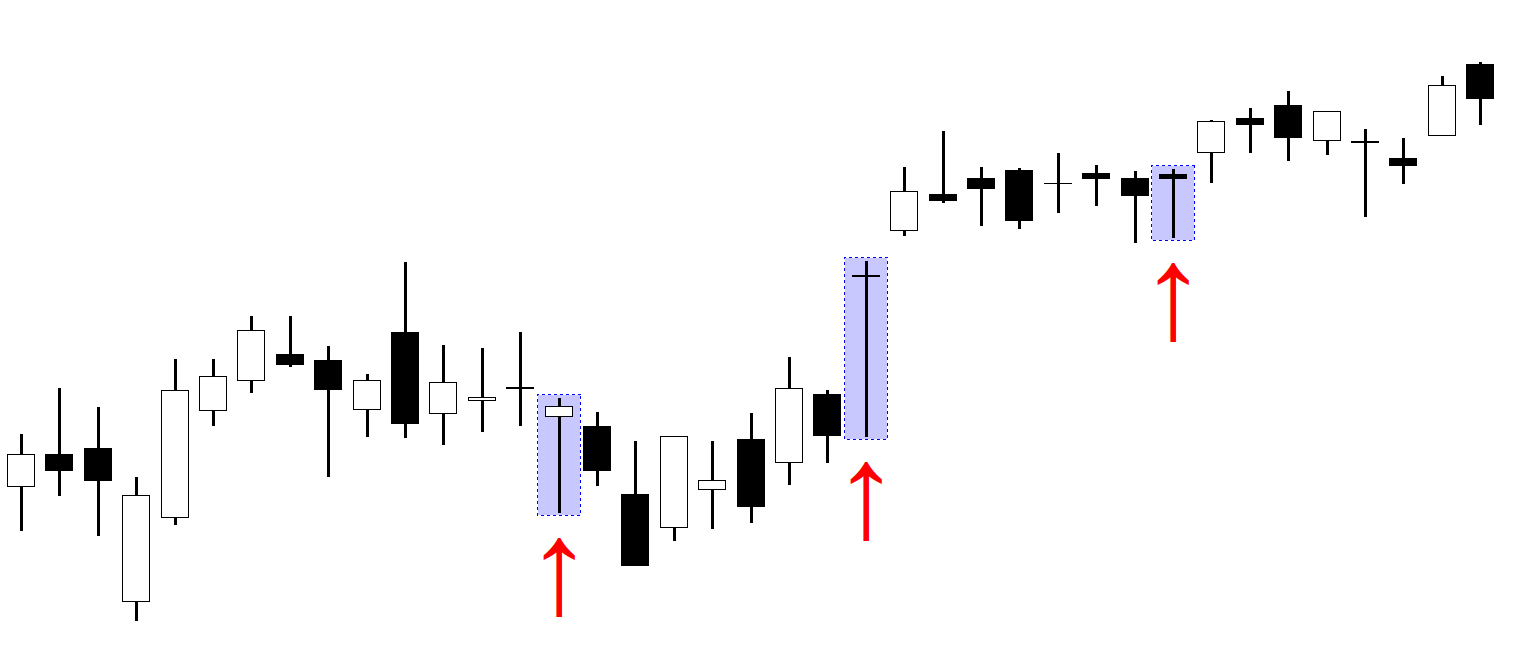
It is important to note that the Dragonfly Doji pattern should be used in conjunction with other technical analysis methods and market context to confirm a potential trend reversal. While the Dragonfly Doji can be a useful price pattern, it should not be the sole basis for a trading decision. It is essential to thoroughly understand the market context and consider other technical indicators, such as moving averages, support levels, and volume analysis.
Dragonfly Doji Candlestick Pattern Backtest
We recommend backtesting all your trading ideas – including candlestick patterns.
To backtest candlestick patterns, you need to set specific rules and definitions. That requires time and effort, but don’t worry: it’s alre