Morning Star Candlestick Pattern: Backtest Results
The candlestick chart is very popular among traders — not just because it is easy to visualize but also because the candlesticks can form shapes and patterns that traders can use to predict how the price might move in the future. One such pattern is the Morning Star pattern. What is the Morning Star pattern, and how do you use it in trading?
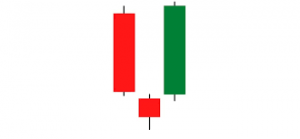
The Morning Star is a bullish reversal pattern that consists of three candlesticks — a tall bearish candle followed by a small candle that gaps below the first candle, and then a third candle that is bullish and closes above the midpoint of the first candle. This pattern is considered a strong indication of a potential bullish price reversal.
In this post, we take a look at the Morning Star candlestick pattern.
Introduction to Morning Star Candlestick Pattern
The Morning Star candlestick pattern is a price action analysis tool used to identify potential trend reversals on the price charts. This pattern is composed of three candlesticks, with the first one being a tall bearish candle. The second candle is a small one that opens and closes below the first candle, creating a gap. The third candle is bullish and closes above the midpoint of the first candle.
The pattern forms at the bottom of a downtrend or a downward price swing in an uptrend. It signifies a slowing down of downward momentum before a large bullish move lays the foundation for a new upward move.
The Morning Star pattern is considered a strong indication of a potential bullish price reversal. This pattern is widely used by traders and analysts to predict future price movements. It is especially useful for price action traders and chartists, who rely on the price action on the chart for spotting trading opportunities.
The pattern occurs on any financial market chart, such as stocks, forex, and commodities, and it can be seen on different timeframes. It is a valuable tool for traders and investors to identify potential trend reversals and the resulting trading opportunities.
Morning Star Candlestick Pattern Backtest
We recommend backtesting all your trading ideas – including candlestick patterns.
To backtest candlestick patterns, you need to set specific rules and definitions. That requires time and effort, but don’t worry: it’s already done for you!

We have defined ALL 75 candlestick patterns and put them into strict testable trading rules. Each candlestick pattern is backtested and includes rules, settings, statistics, probabilities, and performance metrics.
Even better, you get the rules with Amibroker or Tradestation/Easy Language code (in addition to plain English if you like to code yourself, like putting it into a Python trading strategy, for example).
Click here to read more or order.
What are the components of the Morning Star pattern?
The Morning star pattern is a three-candle reversal pattern. It consists of three candlesticks, as follows:
- First candle: The first candlestick is a tall bearish candle, in line with the ongoing downward price swing. It shows that the downswing is still intact.
- Second candle: The second candlestick is a small-bodied candle, typically a doji or a spinning top. It gaps down from the first candlestick. It can be of any color, but the most important thing is that it is small and gaps below the first, in anticipation of the continuation of the existing downswing. Its typical small size suggests indecision in the market. If it is a doji, the pattern is called Morning Doji Star.
- Third candle: The third candle is bullish and quite sizeable. It opens below the second candle and closes above the midpoint of the first candle. In other words, it engulfs the second candle and pierces the first candle, indicating a potential shift in the price momentum from bearish to bullish.
How to identify the Morning Star pattern in stock charts?
Identifying the Morning Star pattern is easy. Here are the features to look for:
- A down price swing: The pattern typically appears at the bottom of a downward price swing, which can be a downtrend or a pullback in an uptrend. So, you should look for it in the right place.
- A tall bearish candlestick: The first candlestick in the pattern should be a tall bearish candle, in line with the ongoing down move.
- A gap: after the first candlestick, the price gaps down to form the second candle.
- A small candlestick: The second candlestick in the pattern is small and be either a spinning top or a doji pattern.
- A bullish candlestick: The third candle in the pattern is a sizeable bullish candle that spans from the low of the second candle to beyond the midpoint of the first candle.