
Neutral Doji Candlestick Pattern: Backtest Findings
Sometimes, the bull and bears fight each other to a standstill, giving rise to a Neutral Doji candlestick pattern. As with many other candlestick patterns, this pattern tells a story about the market and how the price might move in the future. Let’s take a look at the Neutral Doji candlestick pattern.
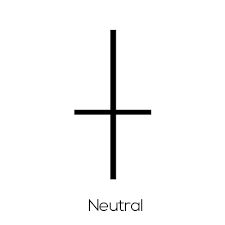
The neutral doji candlestick pattern is a single-candle pattern that is characterized by little or no real body and equal-sized upper and lower shadows. The pattern is pretty common and can form anywhere on the price charts. Depending on where it forms and as a part of other patterns, such as morning doji star, harami star, and evening doji star patterns, it can have a bullish or bearish reversal significance, as the case may be.
In this post, we take a look at the Neutral Doji candlestick pattern.
Understanding the neutral doji candlestick pattern
The neutral doji is a one-candle pattern that shows little or no difference between the opening and closing prices, resulting in a small or non-existent body with equal upper and lower shadows. This pattern is commonly found on price charts and can indicate either a bullish or bearish reversal, depending on its location on the chart and whether it is a part of other patterns like the morning doji star, harami star, and evening doji star.
The pattern can have different interpretations depending on its location and relationship to other patterns. When the neutral doji forms at the bottom of a downward swing, it can indicate a bullish reversal, suggesting that the bears are losing control and the bulls may take over. This is especially true if it forms a part of popular bullish reversal patterns, like the morning doji star and bullish harami star patterns.
Conversely, if it forms at the top of an upward swing, it can indicate a bearish reversal, suggesting that the bulls are losing control and the bears may take over. This is especially true if it forms a part of popular bearish reversal patterns, like the evening doji star and bearish harami star patterns.
Neutral Doji Candlestick Pattern Backtest
We recommend backtesting all your trading ideas – including candlestick patterns.
To backtest candlestick patterns, you need to set specific rules and definitions. That requires time and effort, but don’t worry: it’s already done for you!

We have defined ALL 75 candlestick patterns and put them into strict testable trading rules. Each single candlestick pattern is backtested and includes rules, settings, statistics, probabilities, and performance metrics.
Even better, you get the rules with Amibroker or Tradestation/Easy Language code (in addition to plain English if you like to code yourself, like putting it into a Python trading strategy, for example).
Click here to read more or order.
How to identify a neutral doji pattern
Identifying a neutral doji pattern is relatively simple, as it has a unique appearance on the price chart. To identify this pattern, you need to look for the following characteristics:
- Very little or no real body: The real body of the candle should be very little or non-existent, as the opening and closing prices are almost at the same level.
- Equal upper and lower shadows: The upper and lower shadows should be approximately equal in length, and they are not too long.
- Any color: The pattern can have any color, bullish (white or green) or bearish (black or red), depending on whether the closing price is marginally below or above the opening price.
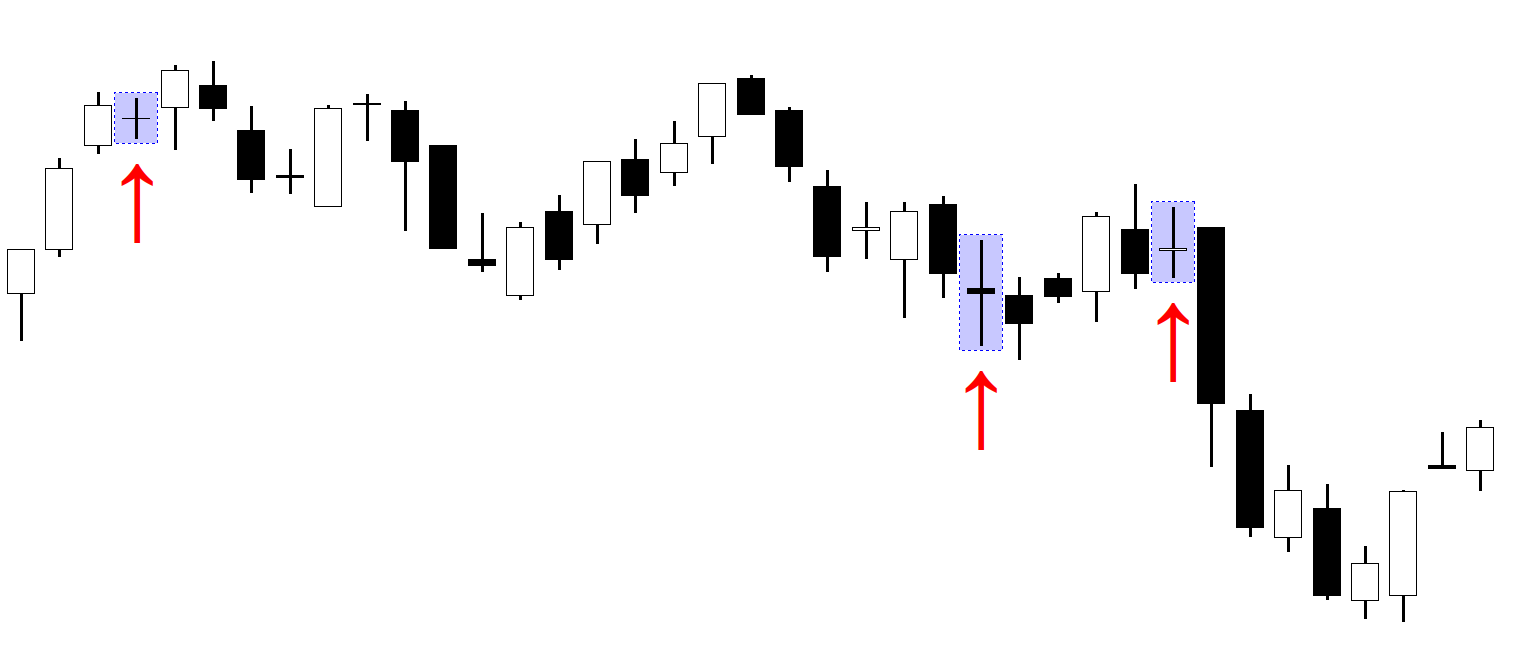
The neutral doji can form anywhere on the price chart, either after an upswing or a downswing. To accurately identify a neutral doji pattern, you need to look at the context in which it forms — whether it forms in a downswing or an upswing and as a part of another pattern.
The significance of the neutral doji in technical analysis
Generally, the doji candlestick pattern signifies indecision among buyers and sellers during the trading session the candle represents. This can be seen from the way the price moved during that session: it moved up and down by about the same length and ended up closing around the same level where it opened, giving it a ‘+’ shape. As a result, the candle has no real body.
With the way the price moved, it shows that neither the bulls nor the bears dominated the session, which is why it is considered an indecision pattern. However, when you consider where the pattern forms, it could actually signify a halt in momentum. If the pattern forms at the bottom of a downtrend, it could be interpreted as the bearis