
Supertrend Indicator Trading Strategy – (Backtest And Performance)
In this article, we will discuss an indicator called SuperTrend, which has a very promising name. So, what is the Supertrend Indicator Trading Strategy exactly?
The SuperTrend indicator is a type of trend following indicator that was created by trader Oliver Seban. It signals the direction of a trend, its continuation, or changes in direction. Our backtest reveals that the indicator can catch most of the returns while avoiding the worst drawdowns, thus giving acceptable risk-adjusted returns.
In the rest of this article, we will test its effectiveness and explain how it works.
What is the Supertrend Indicator Trading Strategy?
Oliver Seban has given us a great tool for highlighting the direction in which an instrument’s price is moving. However, as we will see, the SuperTrend Indicator is useful not only for chartists but also for those who want to do algorithmic trading.
The SuperTrend indicator appears as a line superimposed on the price chart. If the price increases, it will be above the Supertrend indicator, which will be green. Vice versa, if the price is decreasing, it will be below the indicator, which will be red.
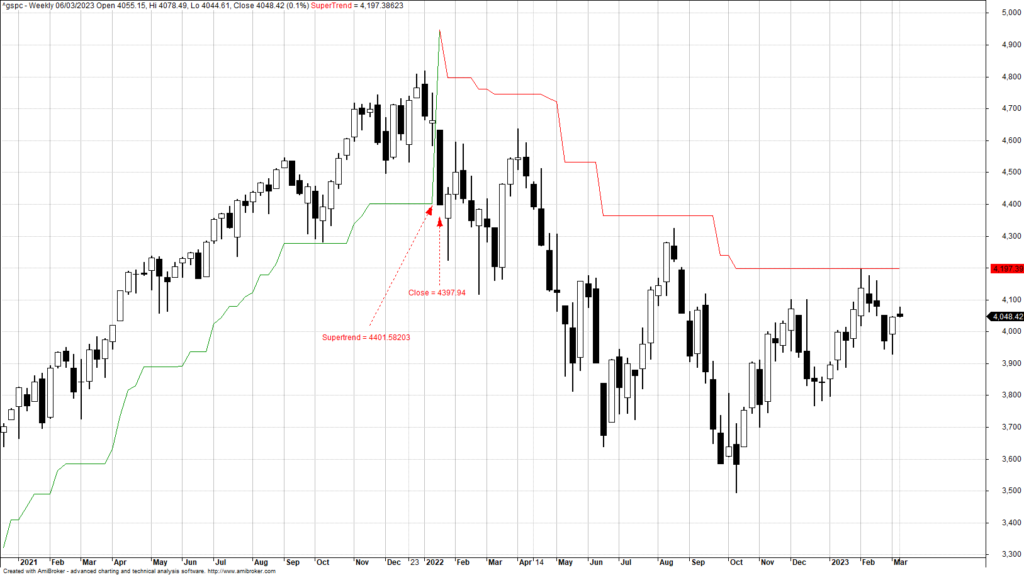
If the price of a bar closes by crossing the previous period’s SuperTrend indicator value, the SuperTrend indicator will reverse direction, indicating a trend change. We observe this feature in the image:
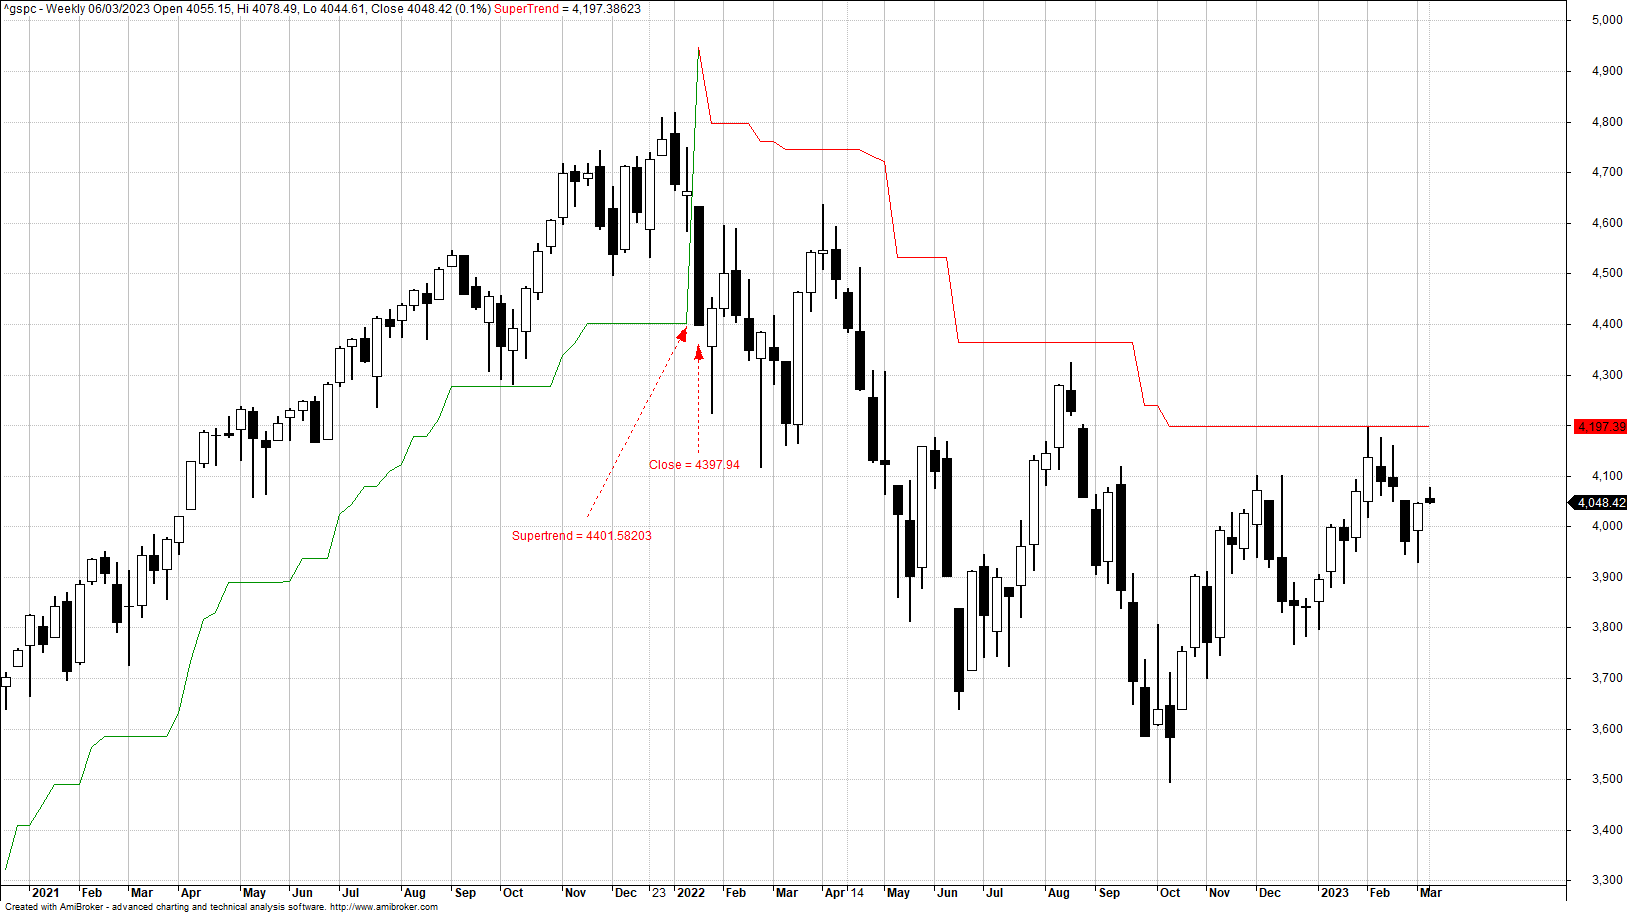
In the chart above, the close of the candle at 4397.94 determines the inversion of the Supertrend indicator because this value is lower than the value of 4401.58203 that the indicator had in the previous period.
Another important feature that we can see in the image above is that the Supertrend indicator is always increasing when it is below the closing price and always decreasing when it is above it.
We can therefore say that the Supertrend indicator alternates between two phases: a phase in which it is increasing, signaling an upward trend, and a phase in which it is decreasing, indicating a downward trend.
How accurate is the Supertrend indicator?
At this point, we might ask ourselves: How accurate is the Supertrend Indicator Trading Strategy?
The answer cannot ignore the objective for which the Supertrend indicator was invented: To highlight trends, as its name implies. As we will see later in our backtest, the Supertrend indicator can be a very accurate tool as long as it is applied to financial instruments that tend to maintain a direction in the price. So it may not be suitable for analyzing any random financial instrument.
Which time frame is best for the Supertrend Indicator Trading Strategy?
The Supertrend indicator has no specific time frame. It can be applied intraday, daily, or weekly charts. But in order to allow the Supertrend indicator to be accurate and do its job well, it is essential to choose a time frame in which the financial instrument is in a trend for long periods.
Which time frame is the most suitable for you can only be found out by backtesting. Later, in our backtest, we use a weekly time frame, and you’ll discover that the Supertrend indicator works well for stocks in that time frame.
How to avoid false signals?
Every quantitative trader aims to improve the historical performance of his trading system. To do this, he or she can optimize by using different inputs into the parameters while (hopefully) avoiding overfitting and curve fitting.
If the historical performance improves, it is possible to avoid false signals that would have generated unprofitable trades. How can we achieve this with the Supertrend Indicator? The indicator has two input parameters that must be established to avoid false signals.
The Supertrend indicator formula
The Supertrend indicator is based on the median price of a candle – calculated like this:
MedianPrice = ( H + L ) / 2;
….and on the very famous volatility indicator called Average True Range indicator presented by Welles Wilder in the 1970s, in his famous book called New Concepts in Technical Trading Systems, published in 1978. If you want to know more about ATR, please read Average True Range Trading Strategy (ATR Indicator and System – How To Use It).
The formula of the Supert