
Fabian Market Timing Model – What Is It? (Video, Performance, Strategy Rules, and Backtest)
Today we will look at another trend following strategy developed by a famous fund manager long ago. It’s called Fabian Timing Model and was developed by Richard Fabian in the 1960s.
The Fabian timing model is a simple quantitative long-term trend following strategy for the stock market. It is based on an intermarket signal between the S&P 500, The Dow Jones Industrial Average, and the utilities sector.
In this article, we look at what a market timing model is, the Fabian timing model strategy, the trading rules, and how the strategy has performed.
The strategy is taken from our landing page of trading systems.
What is a Market timing model?
Market timing is the attempt to anticipate the future movement of an asset. Trying to predict the future is already very hard to leave to subjective factors, which you will never be sure what you are supposed to do at any given moment. This is why market timing models are built quantitatively so that trading becomes mechanical rather than discretionary.
- Automated Trading Strategies Vs. Discretionary Trading Strategies
- Advantages with Mechanical Rules and Edges
The decisions of when to buy and sell are based on previously specified trading rules. What you think may happen at any given time shouldn’t be considered or included in the model.
The most critical aspect of trading a timing model is following the system and your strategy. You can devise the most outstanding portfolio in the history of investing, but it will do you no good unless you commit your money to it and follow the signals. Most people will sooner or later abandon the system or override it.
Also, it’s very important to give the model enough time to work because anything can happen in the short term. In the long term, if you have chosen a strategy carefully and followed the trading rules, you should be rewarded accordingly.
What is the Fabian Market Timing Model?
The Fabian market timing model is a trend-following strategy for S&P 500 based on its 39-week moving average. The Dow Jones Industrial Average confirms the signals and the utilities sector respective 39-week moving averages. This is key in reducing, but not eliminating, false signals.
The model was created by Richard Fabian, a very successful writer, money manager, author, and speaker. He explains this strategy in his book The mutual fund wealth builder.
Although he argued that no one could come up with consistently good market timing predictions on their own, nor was he smart enough to assess all available information correctly, he strongly recommended adhering to some mechanical system. Also, he did not say that his model was perfect but that by trying to perfect any timing model, we would have no strategy.
Fabian Market Timing Model trading rules
The buy and sell rules for the Fabian market timing model are simple, and they are executed at the end of each week:
- Buy the SPY if all three indices are greater than their respective 39-week moving averages.
- Sell SPY if two or more of the indices are trading under their respective 39-week moving average
(The buy and sell rules for the Fabian timing model are simple and executed at the end of each week. We have backtested the original trading rules, and the results are in the article’s next section. If you want to know the specific trading rules, you must (at least) become a Bronze member).
Fabian Market Timing Model Python Backtest
Trading Rules
[am4show have=’p2;p3;p58;p59;p130;p138;’ user_error=’Premium Post Access’ guest_error=’Premium Posts’]
We backtested the strategy with python since 2000 using the SPY, ^DJT, and XLU (SPY and XLU are ETF)s. The data is not adjusted for dividends or splits.
[/am4show]
Here is the equity curve:
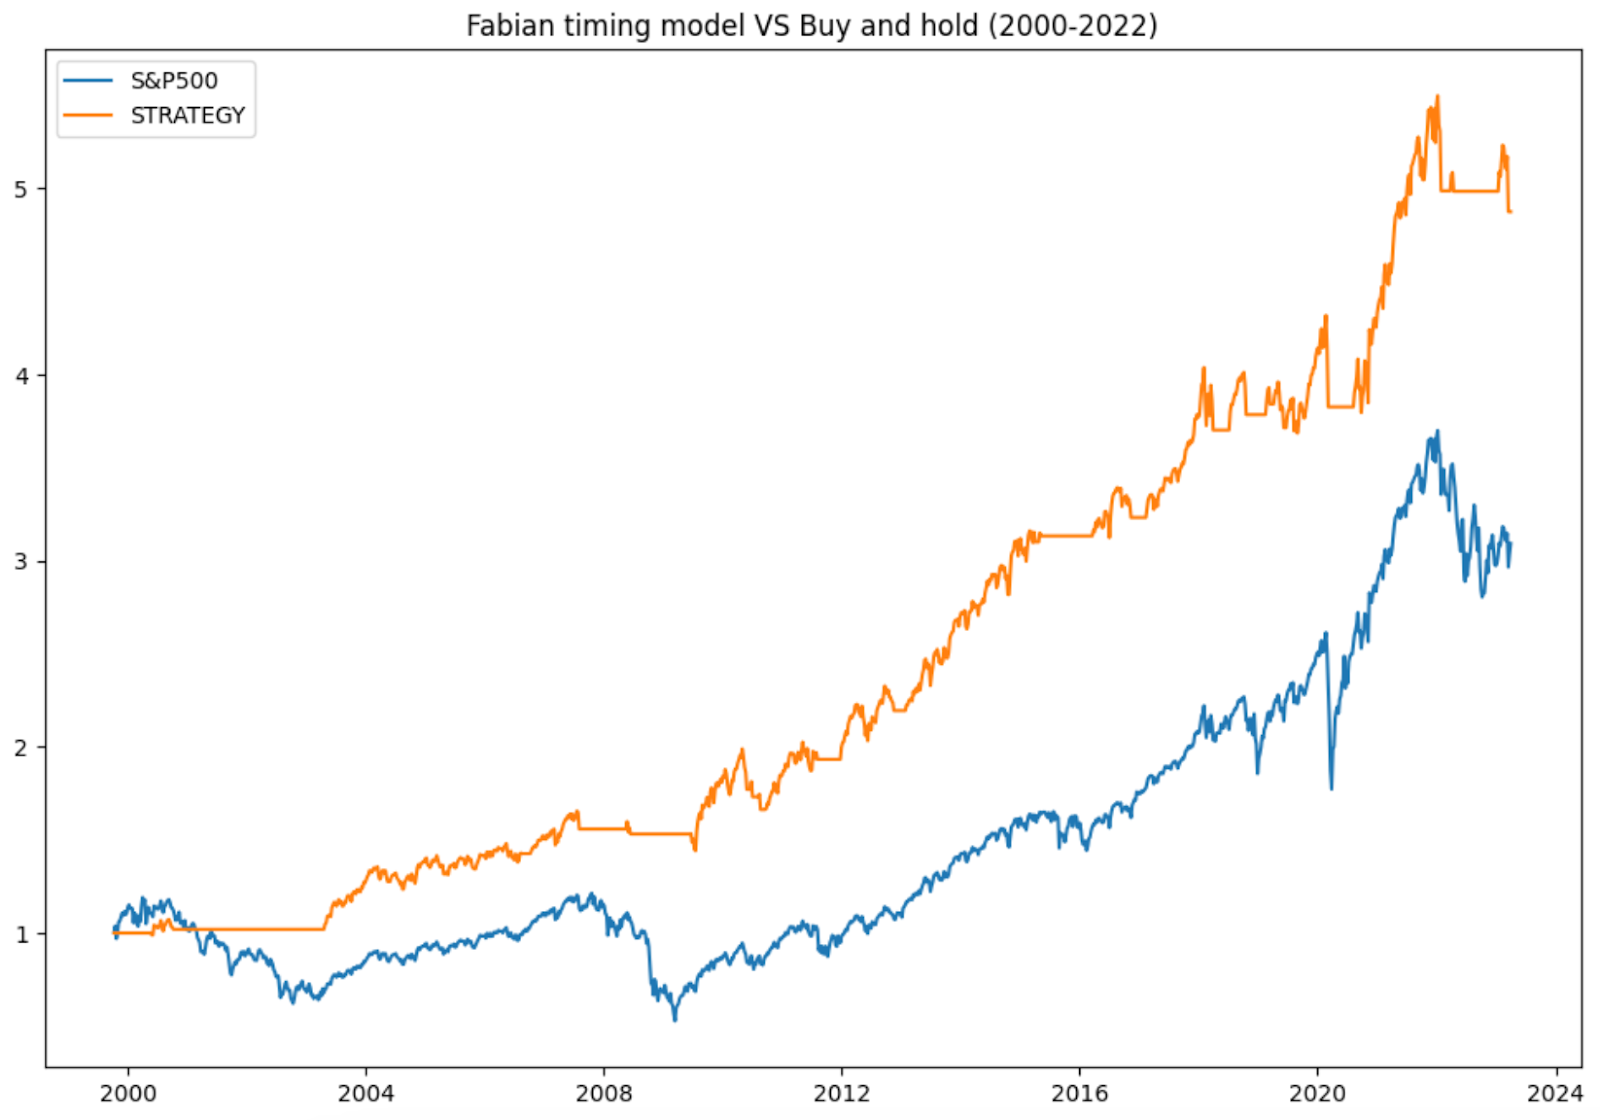
The equity curve looks pretty good! Here are the trading statistics and performance metrics:
- CAGR is 6.95% (buy and hold 4.90%)
- The standard deviation is 9.87 (17.96)
- Time spent in the market is 56.20%