
S&P500 And Gold – Rotate In And Out Of The Assets for Enhanced Portfolio
SPY is the ETF for S&P 500 and GLD is the ETF for the gold price.
Michael A. Gayed, CFA, presented a SPY/GLD rotation strategy on ritholtz.com in July 2011.
SPY is the ETF for S&P 500 and GLD is the ETF for the gold price.
Michael A. Gayed has been a portfolio manager for a few hedge funds and is active on Twitter with a huge following.
The strategy read like this in plain English:
1. I downloaded daily price data for both GLD and SPY going back to inception of GLD (11/18/2004) using Yahoo Finance (Adj. Closing Prices).
2. Calculated End of Day returns for both
3. Created a price ratio (GLD divided by SPY)
4. Created a 20 day simple moving average of that ratio
5. Put an if/then statement such that if the GLD/SPY price ratio was greater than the 20 day MA of the ratio, to track the performance of GLD. If not, track performance of SPY. Assumption is that using prices very close to end of day closing prices creates the rotation right at that moment for holding to be there next day
We somehow decided to change the rules a little bit to make them easier to follow: we switch to monthly bars:
Trading Rules
[am4show have=’p2;p3;p58;p59;p130;p138;’ user_error=’Premium Post Access’ guest_error=’Premium Posts’]
- We use monthly bars.
- Calculate the SPY/GLD ratio.
- Calculate a 6-month moving average of the SPY/GLD ratio.
- If the ratio is above its 6-month moving average, be long SPY the next month (no position in GLD).
- If the ratio is below its 6-month moving average, be long GLD the next month (no position in SPY).
The idea is to switch between the two asset classes. We tried several lengths of the moving average, and it works pretty well for whatever number of months.
By using a 6-month length of the moving average we get the following equity curve:
[/am4show]
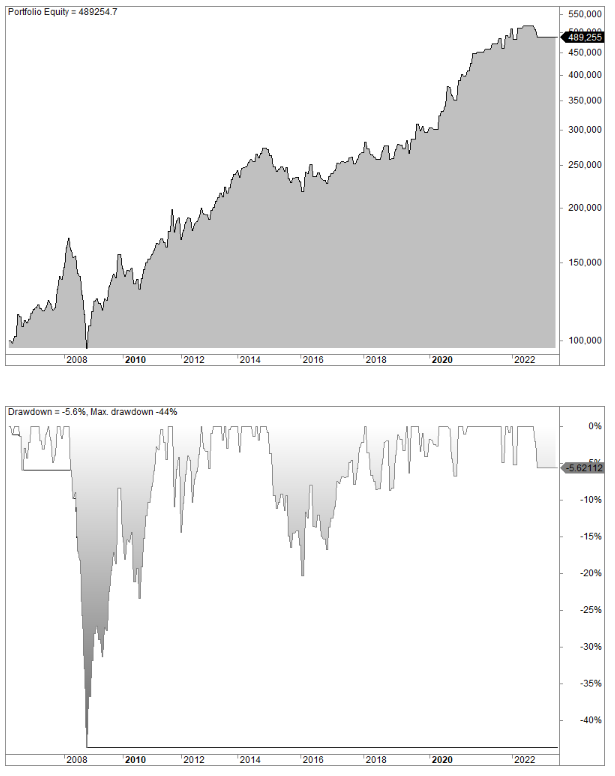
CAGR is 9.8%, not including dividends. We can safely say it’s above 10% if we include dividends in SPY.
The annual returns:

FAQ:
What is the SPY/GLD rotation strategy?
The SPY/GLD rotation strategy is an investment approach that involves switching between two ETFs, SPY (S&P 500) and GLD (gold), based on a calculated ratio. The goal is to allocate funds to the ETF that is expected to perform better, using a moving average of the SPY/GLD ratio as a signal for rotation.
How does the equity curve reflect the performance of the SPY/GLD rotation strategy?
The equity curve illustrates the strategy’s performance over time. In the case of a 6-month moving average, the equity curve shows positive growth with a Compound Annual Growth Rate (CAGR) of 9.8%, indicating the strategy’s effectiveness in capturing returns.
Does the CAGR of 9.8% include dividends?
The CAGR of 9.8% mentioned does not include dividends. Including dividends in SPY could potentially raise the CAGR to above 10%, further contributing to the strategy’s overall returns.