Timing the Market with Healthcare Stocks: Rotation Trading Strategy Overview
This article shows a rotation strategy between healthcare stocks and the S&P 500.
The trading idea is pretty simple, but it beats the buy and hold of the S&P 500. Moreover, we believe this strategy is more rational than at first glance. Keep reading for more details:
It’s based on seasonalities among the two assets/sectors and switches once per year. We are uncertain if it’s tradeable, but that is of course up to you.
[am4show have=’p2;p3;p58;p59;p130;p138;’ user_error=’Premium Post Access’ guest_error=’Premium Posts’]
The strategy owns healthcare stocks from the end of April until the end of September and owns the S&P 500 from the end of September until the end of April.
It’s pretty well known that the adage “sell in May and go away” is not a myth:
Sell in May and go away recap:
The chart below shows the S&P 500 from 1960 until June 2021 by being invested from the close of April until the close of September every year:
100 000 invested in 1960 has compounded at a measly 0.1% annual return!
Compare this to being invested from the close of September until the end of April:
The CAGR is 8.1%. Even better, the drawdown is reduced from 55% (buy and hold) to 48%. We used free data from Yahoo/finance and the ticker code ^gspc. This is a cash index and doesn’t include reinvested dividends. Thus, the real returns are slightly higher if dividends were reinvested.
Healthcare stocks perform well during the summer:
However, it turns out there is a sector of the stock market that performs pretty well during the doldrums of the summer: healthcare.
As a proxy for healthcare stocks we use Fidelity’s healthcare fund:
FSPHX: Fidelity’s healthcare mutual fund holdings:
Why do we use FSPHX? Mainly because we get data back to 1981 – much longer than any ETF on the market. Second, the fund holds a pretty diversified portfolio of healthcare stocks.
The current ten biggest holdings of FSPHX are these:
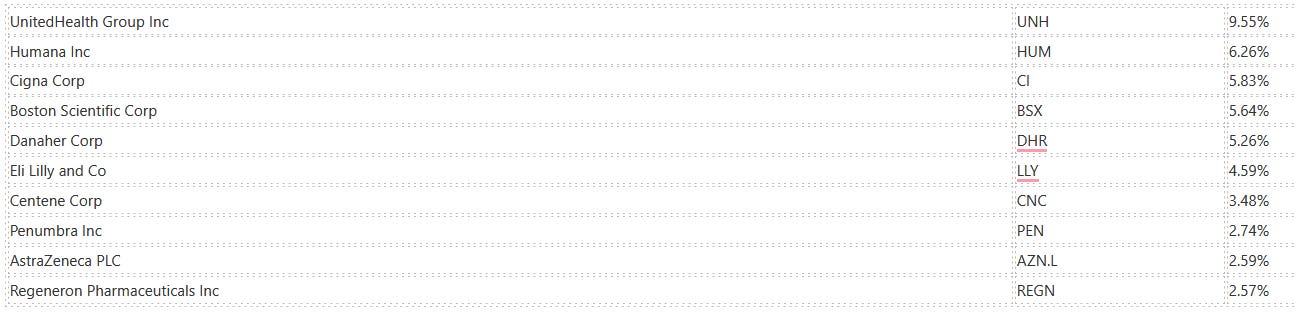
Keep in mind that FSPHX is an active fund – not a passive one.
Fidelity Healthcare Fund (FSPHX) seasonalities:
Let’s first measure how Fidelity’s healthcare fund performed during the best period for stocks overall, namely from October until May:
It turns out the performance is substantially lower than the S&P500 during this period: only 4.4%.
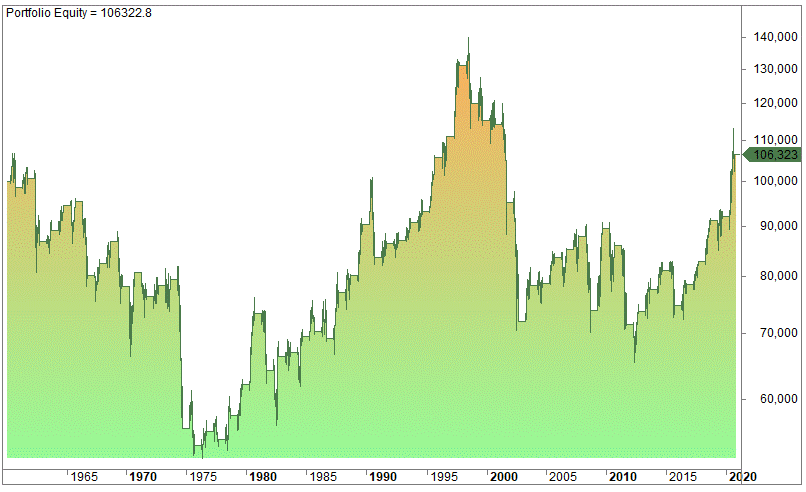
How has Fidelity’s healthcare fund performed by being invested only from May until October?
Healthcare stocks have performed much better than the S&P 500 from 1981 during this period: 5.4% vs 0.9%. The drawdown is “only” 30%, which happened in 2003. For 2008 the drawdown was a minuscule 9%.
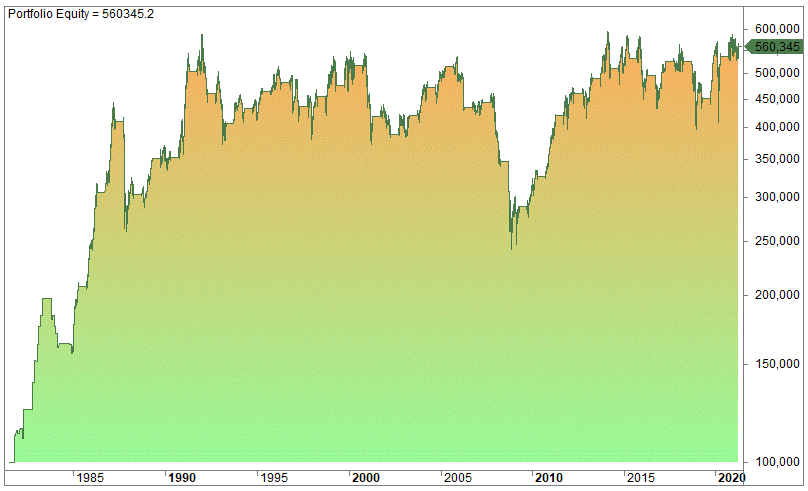
However, the best seasonality for healthcare stocks is from the end of April until the end of November, but that is not an option because you want to be invested in the S&P 500 from October. This is the chart of being invested in healthcare stocks from April until November:
The CAGR goes up to 7.33% even though the crash of 1987 hit healthcare hard.
Why are healthcare stocks good during the summer?
We don’t know. Perhaps it’s a safe haven because stocks, in general, perform poorly? A positive aspect of healthcare stocks is that they are pretty defensive in nature. Many of them have a regulatory moat and they tend to be profitable in both recessions and expansions of the economy.
Can this strategy be used on the ETF with the ticker code XLV? Yes, probably, but we didn’t test on this ETF.
As usual, use your own due diligence. However, because we switch only twice per year, it shouldn’t cause any major problems going in and out of FSPHX or any other open-ended mutual fund, just be aware of the time it takes to buy and redeem.
How the sector rotation strategy between healthcare and the S&P 500 performed:
Let’s test the sector rotation trading strategy. The trading strategy is as follows:
- From the close of April un the close of September, we own healthcare stocks (FSPHX).
- From the close of September until the close of April we hold the S&P 500 (^gspc).
It can hardly get any simpler than that.
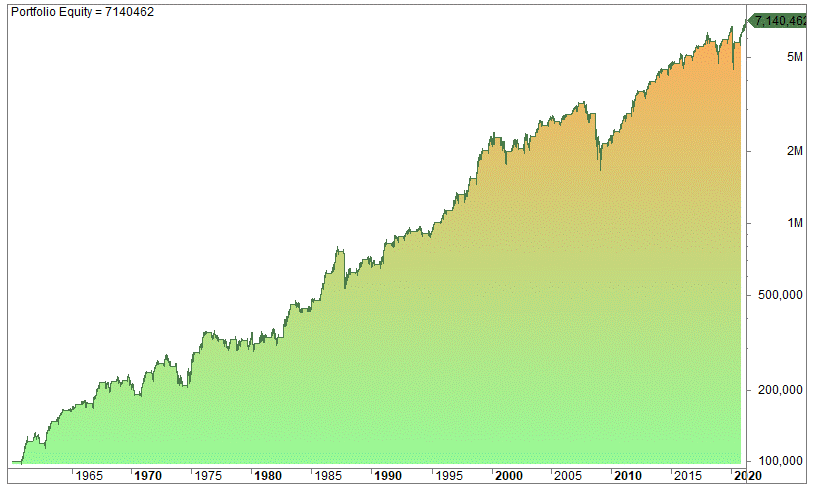
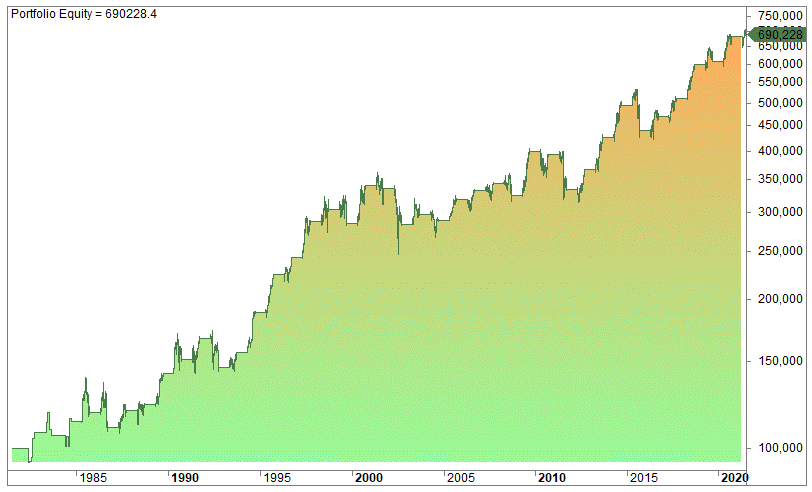
100 000 invested in 1981 returns this equity chart by compounding and reinvesting the returns:
The CAGR is a pretty impressive 13.1% (not including reinvested dividends in the S&P 500) and the drawdown is 51% in 2008.
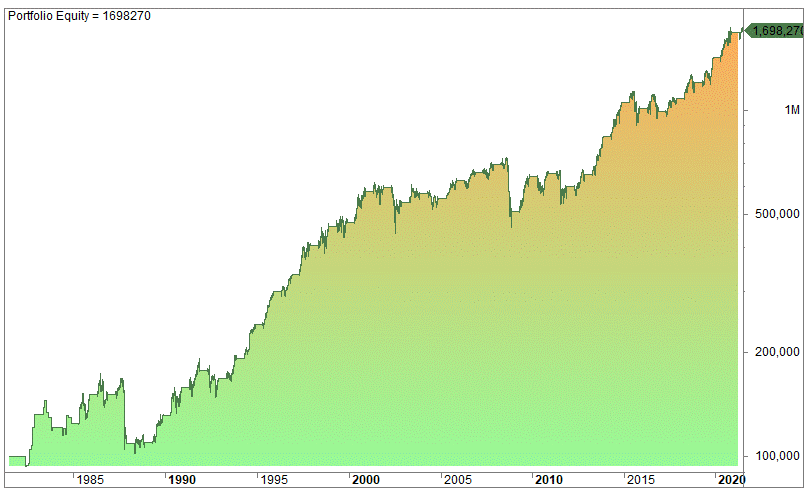
If we test by using the ETF with ticker code SPY (which includes dividends) since 1993 we get this equity chart:
The CAGR is 14.25% and the drawdown is 50% in 2008.
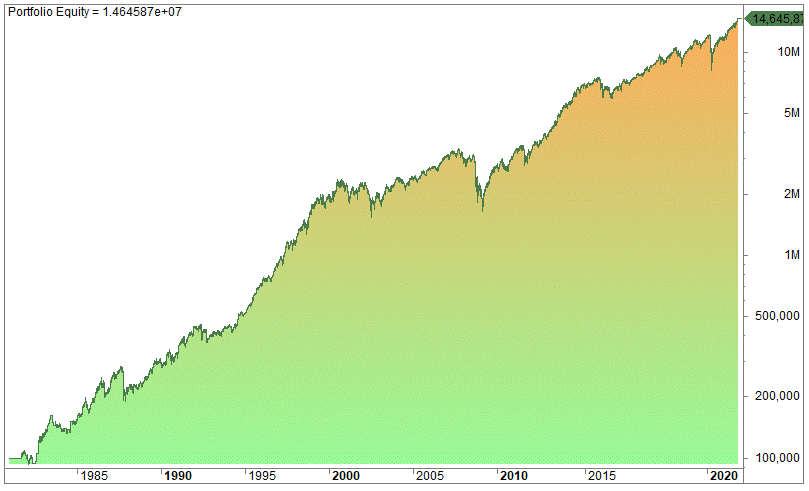
Buy and hold for the S&P 500 (SPY) was 10.3% during the period.
The difference in the compounded result is enormous: from 1993 until June 2021 the rotation strategy ends up with 4.45 million, while buy and hold SPY only ends up with 1.622 million.
Just “small” differences add up over time, although 4% more per year can hardly be called small.
[/am4show]
Conclusion:
Is this a tradeable trading strategy?
Among all the equity rotation strategies that have been published on the internet, we believe this one makes sense for a number of reasons:
- You still own productive values by switching or rotating from the S&P 500 to healthcare stocks. Not gold or gold mining stocks.
- Healthcare stocks are a pretty diversified group. It has many sub-sectors.
- Healthcare stocks are more defensive and non-cyclical than most sectors.
However, as always, this is not investment advice but only information. At the end of the day, make sure you do your due diligence.
FAQ:
How does the rotation strategy work?
The strategy holds healthcare stocks from the end of April until the end of September and the S&P 500 from the end of September until the end of April. This approach is based on historical patterns, particularly the “sell in May and go away” phenomenon.
What is the rationale behind the “sell in May and go away” concept?
Historical data shows that being invested in the S&P 500 only from October until April has outperformed the strategy of being invested from May until September. The latter has yielded lower returns with higher drawdowns, supporting the seasonal rotation idea.
Why are healthcare stocks chosen for the rotation strategy during the summer months?
Healthcare stocks, represented by Fidelity’s healthcare mutual fund (FSPHX), have historically performed well during the summer months. These stocks are considered defensive, potentially acting as a safe haven during periods of overall market underperformance.