The Worst Trading Days of the Year for Stocks
What are the worst days of the year for trading stocks? Let’s find out and test from the year 2000.
We did a backtest where we optimized the month and trading day to find the WORST trading days for the S&P 500 from the year 2000. We remind you that the TRADING day is different from the calendar day.
We backtested the result by entering at the close of trading day N and selling at the close the next day. In other words, this is an overnight trade.
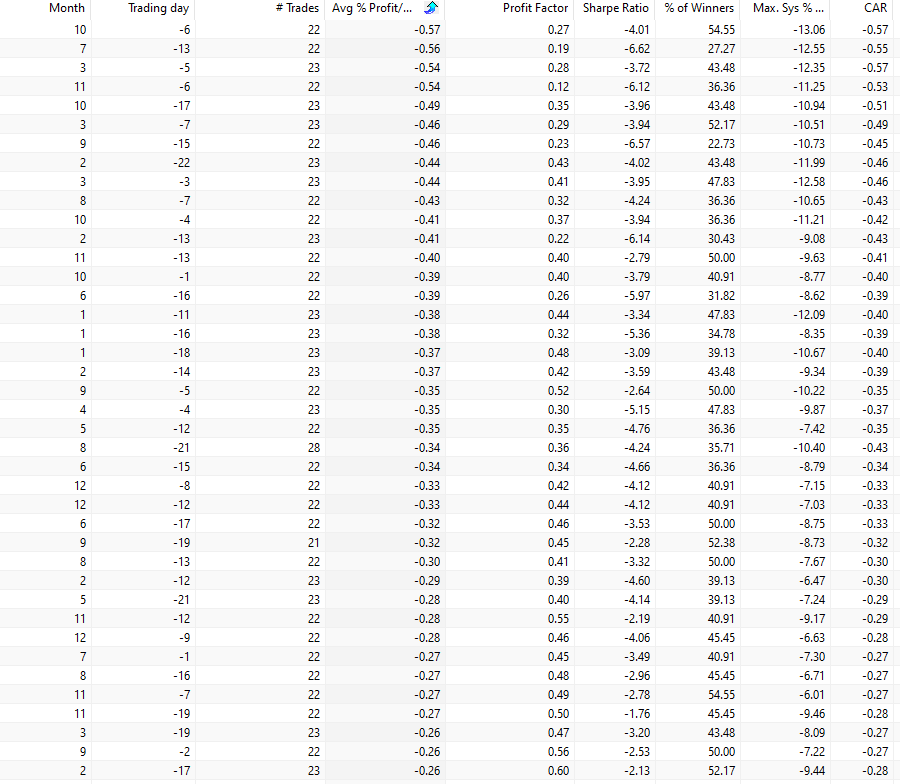
The table below contains the results:
[am4show have=’p2;p3;p58;p59;p130;p138;’ user_error=’Premium Post Access’ guest_error=’Premium Posts’]
Row one says that trading day 6 in October (ignore the minus sign) is the worst with an average negative gain of 0.57% from the close of trading day 6 to the next trading day.
[/am4show]
FAQ:
What is the significance of identifying the worst trading days for stocks?
Identifying the worst trading days for stocks is crucial for investors as it allows them to be aware of historically challenging periods. This knowledge can inform trading strategies, risk management, and decision-making to potentially minimize negative impacts on portfolios.
How was the backtest conducted to find the worst trading days for the S&P 500 from the year 2000?
The backtest involved optimizing the month and trading day, considering the trading day as distinct from the calendar day. The results were obtained by entering trades at the close of a specific trading day and selling at the close the next day. This strategy specifically focused on overnight trades.
What does the table in the content display, and how should it be interpreted?
The table in the content provides results from the backtest, indicating the average negative gain for specific trading days. For instance, if trading day 6 in October has an average negative gain of 0.57%, it implies that historically, the S&P 500 experienced a decline during the overnight trade from the close of trading day 6 to the next trading day.