
20 EMA Trading Strategy – Does It Work? (Rules, Setup, Backtest, Performance)
The moving averages are one of the most used technical indicators in the market. However, there are many types of moving averages. Today we are going to be looking at the exponential moving average: 20 EMA trading strategy.
The exponential moving average is a type of moving average (MA) that places a greater weight and significance on the most recent data points. But a question arises: Can it be used to develop a profitable trading strategy?
In this article, we are going to look at what the 20-day EMA trading strategy is, backtest it, and improve it by adding an additional technical indicator.
Related reading:
- Looking for a good trading strategy? (Hundreds in that link)
- What Is The Best MA?
What is the 20 EMA trading strategy?
The 20-day exponential moving average(EMA) strategy is a technical analysis strategy that uses the 20-day EMA to generate buy and sell signals for trading securities. It uses 20-EMA to identify short-term market swings in the price of a security. EMA gives more weight to the recent prices, which can help traders to accurately identify market swings.
The strategy we are going to backtest, as you are about to see, produces a purchase signal when a security’s price surpasses the 20 EMA, and triggers a sale signal when the price falls beneath the 20 EMA. This method is versatile and can be employed across various securities like forex, stocks, and commodities.
20 EMA trading strategy – trading rules
As we mentioned, the trading signal of the strategy we are going to backtest is pretty simple.
Let’s establish the trading rules:
Trading Rules
[am4show have=’p2;p3;p58;p59;p130;p138;’ user_error=’Premium Post Access’ guest_error=’Premium Posts’]
- We buy the asset when the 20-day EMA is under the asset price
- We sell the asset when the 20-day EMA is over the asset price
[/am4show]
20 EMA trading strategy – backtest
We backtested the strategy using the ETF version of the S&P 500, SPY. The data is not adjusted for dividends and splits. Here is the equity curve:
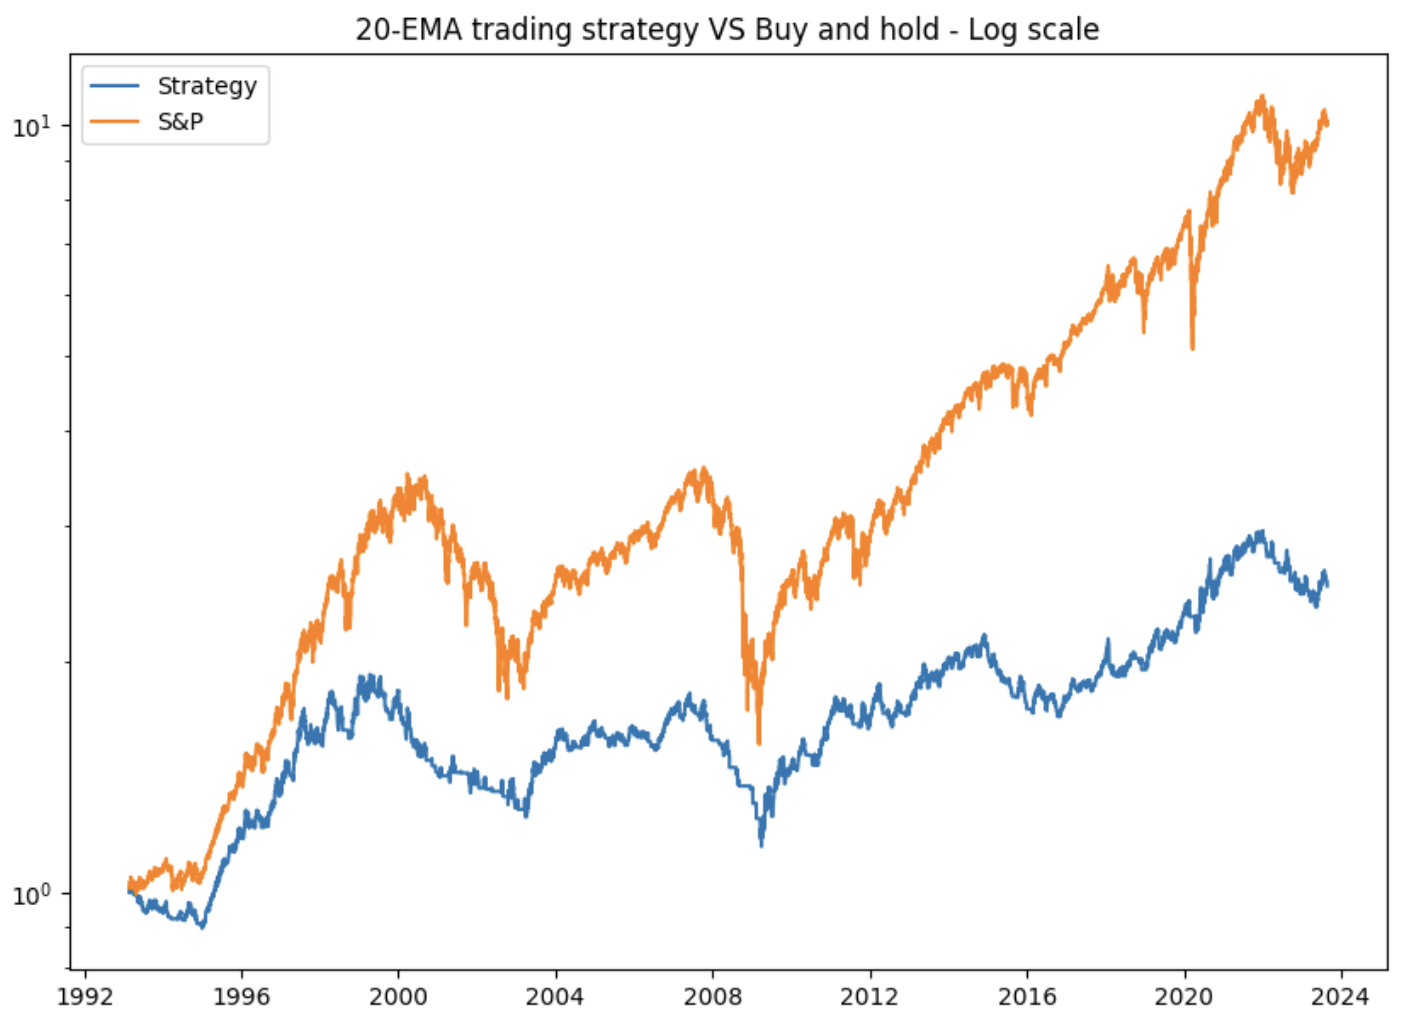
The equity curve does not look so great. Here are some metrics and trading statistics about the strategy:
- CAGR is 3.06% (buy and hold 7.87%)
- Time spent in the market is 67.09%
- Risk-adjusted return is 4.56% (CAGR divided by time spent in the market)
- Maximum drawdown is -42.65% (-56.47%)
As you can see, the CAGR is very low despite being invested almost ~70% of the time. Moreover, the strategy experienced a significant drawdown, although not as hig