
Clean Energy Trading Strategy – Setup, Rules, Backtest, ETF (PBW)
After decades of relying on fossil fuels to power the economy, there is increasing demand for Clean Energy such as solar, wind, and geothermal power. As the world seeks to transition into a green energy future, many traders now seek to participate. Can we create a clean energy trading strategy that trades the clean energy ETF (PBW) profitably?
In this article, we have an example of a trading strategy that so far has made more than +1000% in net profits. Let’s explain the strategy to you:
Related reading:- We have published many more quantitative trading strategies
Invesco WilderHill Clean Energy ETF (PBW)
To find a viable trading edge, we must find a way to trade the clean energy market. This is where exchange-traded funds (ETFs) come into play.
The Invesco WilderHill Clean Energy ETF (ticker name PBW) is such an ETF that invests in companies that stand to benefit from increased adoption of clean energy technologies. We’ll be backtesting this one in this article.
Clean Energy Trading Strategy – indicators and components
The PBW trading strategy in this article uses the indicator from our Donchian Channels trading strategy article. We recommend you read that article for further details on the strategy itself.
In this article, we experiment with short-term settings that are more appropriate for the price fluctuations in PBW, turning it into something closer to a momentum indicator.
The second component of our PBW trading strategy is to use an Exponential Moving Average to reduce the number of false signals we encounter.
Clean Energy Trading Strategy – Trading Rules
The trading logic for this PBW Donchian Channel/EMA Strategy is as follows:
Trading Rules
[am4show have=’p2;p3;p58;p59;p130;p138;’ user_error=’Premium Post Access’ guest_error=’Premium Posts’]
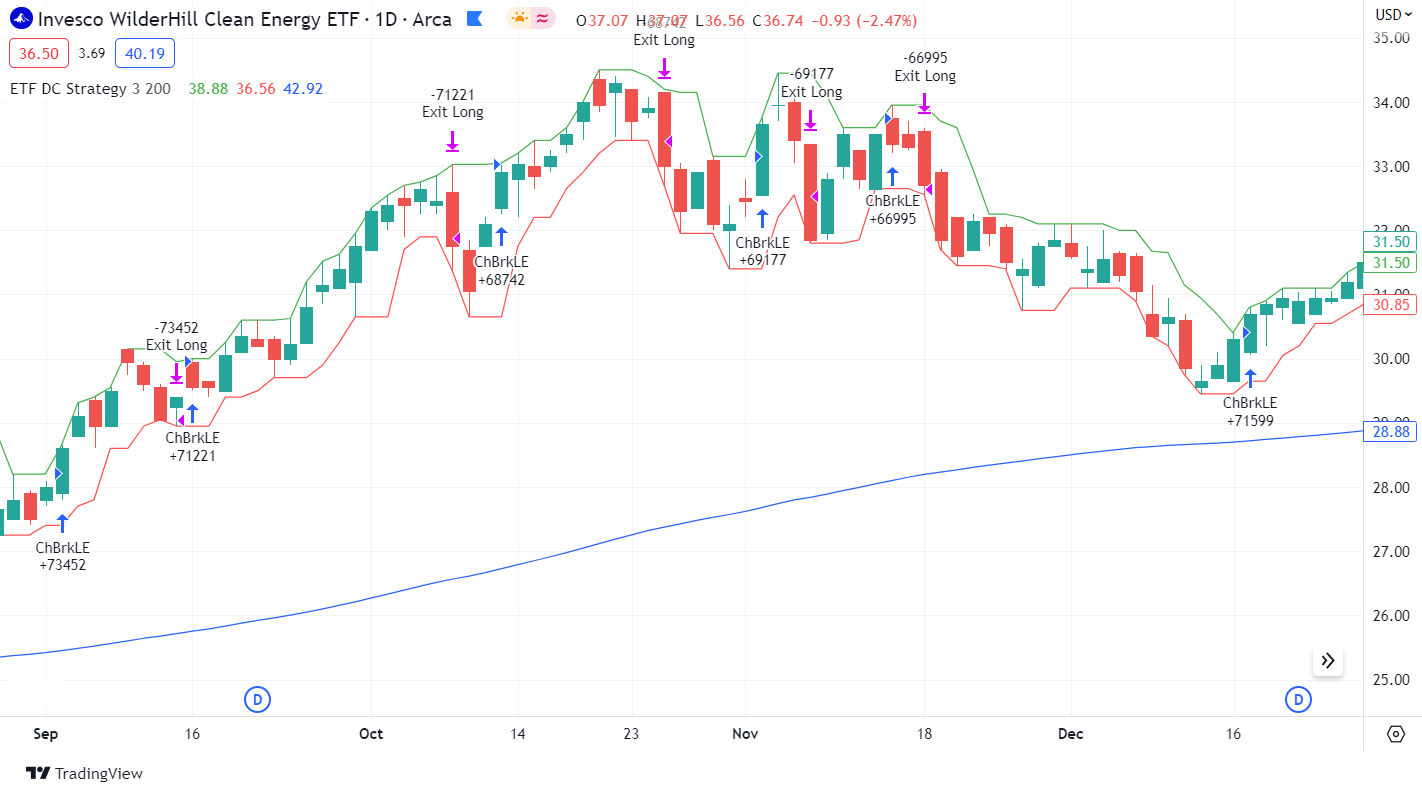
- On the daily timeframe, when the price crosses above the upper band of the Donchian Channels, and price is above the EMA line, we go long (buy) immediately.
- On the daily timeframe, when the price crosses below the lower band of the Donchian Channels, we close our position (sell) immediately.
[/am4show]
This means that we are using the daily timeframe, but trades are entered or exited immediately when the price crosses the Donchian Channels band during the day (thus, we enter intraday, not at the close of the day). We do not wait for the daily close. We achieve this by placing stop orders one tick outside the Donchian Channel band.
This is a ‘long only’ strategy, where we don’t take any short trades.
Displayed on a chart, the trading strategy will look something like this:
PBW Strategy Optimization
Optimizing our trading strategy is an important step in trading strategy development, and is mainly about testing the robustness of our strategy. Contrary to what many think, strategy optimization is helpful, but only if done correctly and not misused.
If the strategy holds up well under changing variables, it indicates that our strategy is robust, and is not curve fitted.
In the PBW Donchian Channel/EMA trading strategy, we have only two variables: The length of the EMA, and the length of the Donchian Channels lookback period.
Let’s start by comparing the results for various Donchian Channels length inputs, without any EMA filter. We have backtested on PBW, on a daily timeframe, from March 3, 2005, until today: