
$100 vs. $1000: Daily Doubling Strategies for a Year
Have you ever wondered how much money you could accumulate by doubling it every day for 365 days (one year)? In this article, we will provide you with the answer to this question by demonstrating the total amount you would have at the end of a year if you were to double your money daily. To illustrate this, we will use initial investments of $100 and $1000 to help you visualize your year-end balances depending on what you choose to start with.
To begin, we will present a table containing detailed daily figures showing your accumulated wealth. Afterward, we will convert these figures into a graph for a more accessible visual representation. At the end of the day, the goal of this article is to help you figure out how you can integrate this formula into your savings and investment strategy regardless of how much you choose to start with. So, without further ado, let’s dive right in!
Doubling income daily for one year ($100 vs $1000)
| Day | Amount 1 (from $100) | Amount 2 (from $1000) |
| 1 | $100 | $1,000 |
| 2 | $200 | $2,000 |
| 3 | $400 | $4,000 |
| 4 | $800 | $8,000 |
| 5 | $1,600 | $16,000 |
| 6 | $3,200 | $32,000 |
| 7 | $6,400 | $64,000 |
| 8 | $12,800 | $128,000 |
| 9 | $25,600 | $256,000 |
| 10 | $51,200 | $512,000 |
| 11 | $102,400 | $1,024,000 |
| 12 | $204,800 | $2,048,000 |
| 13 | $409,600 | $4,096,000 |
| 14 | $819,200 | $8,192,000 |
| 15 | $1,638,400 | $16,384,000 |
| 16 | $3,276,800 | $32,768,000 |
| 17 | $6,553,600 | $65,536,000 |
| 18 | $13,107,200 | $131,072,000 |
| 19 | $26,214,400 | $262,144,000 |
| 20 | $52,428,800 | $524,288,000 |
| 21 | $104,857,600 | $1,048,576,000 |
| 22 | $209,715,200 | $2,097,152,000 |
| 23 | $419,430,400 | $4,194,304,000 |
| 24 | $838,860,800 | $8,388,608,000 |
| 25 | $1,677,721,600 | $16,777,216,000 |
| 26 | $3,355,443,200 | $33,554,432,000 |
| 27 | $6,710,886,400 | $67,108,864,000 |
| 28 | $13,421,772,800 | $134,217,728,000 |
| 29 | $26,843,545,600 | $268,435,456,000 |
| 50 | $5.63E+16 | $5.63E+17 |
| 100 | $6.34E+31 | $6.34E+32 |
| 150 | $7.14E+46 | $7.14E+47 |
| 200 | $8.03E+61 | $8.03E+62 |
| 250 | $9.05E+76 | $9.05E+77 |
| 300 | $1.02E+92 | $1.02E+93 |
| 350 | $1.14E+107 | $1.15E+108 |
| 365 | $3.76E+111 | $3.76E+112 |
The table above shows how your money will constantly grow if you can double it daily for one year. It should be noted that even though there are several days that are not indicated in the table, they were all considered during the computation. We chose to eliminate most of the days in order to make the table more compact. Before diving into the detailed explanations for the data in the above table, let’s first share the graphical representation to make it easier to visualize.
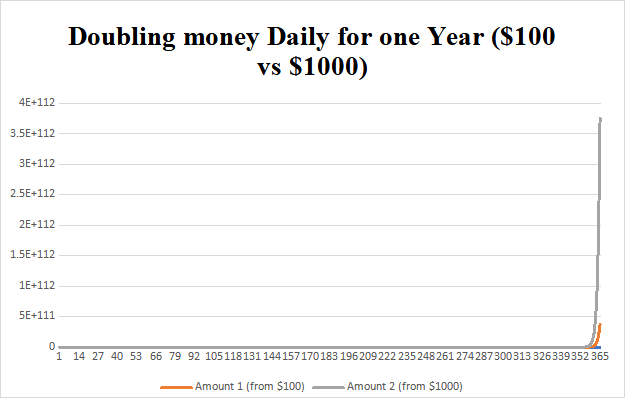
$100 vs. $1000 Doubles Daily for a year – Explanation
As you might have noticed from the table and graph above, the growth in the first few days appears relatively modest. By Day 4, for instance, the $100 investment has grown to $800, and the $1,000 investment has become $8,000. These initial stages might not seem overly impressive, but they are crucial to lay the foundation for exponential growth in the l