

How To Build A Profitable Parabolic SAR Trading Strategy Using Python
Introduction
This tutorial will explain how to implement the Parabolic SAR indicator to build a trading strategy in Python, and along the way, it will introduce the Object Oriented Programming (OOP) approach to download the data, calculate the Parabolic SAR strategy, and generate the buy and sell signals. It’s all about how to build a profitable Parabolic SAR trading strategy using Python.
This tutorial will use data from the ETF AGG; additionally, in the last section, it will implement the QuantStats Python package to obtain performance and risk metrics. But please keep in mind that the main aim of the article is to show how it can be coded using Python. The trading strategy itself is of minor importance.
- Python trading strategy (Backtesting, Code, List, And Plenty of Python Coding Examples)
- Hundreds of free backtested trading strategies
Parabolic SAR
The Parabolic SAR is a trading indicator developed by Welles Wilder, and it aims to identify trends and reversals. This indicator finds short-term entry and exit signals. The Parabolic SAR has as a characteristic that its formula changes depending on whether there is a downtrend or upward trend.
Welles Wilder does not recommend applying this indicator in intervals below an hour or when the price fluctuation is flat.
The calculation for an upward trend is:
\text{PSAR}_t = \text{PSAR}_{t-1} + a_{t-1} (\text{EP}_{t-1} - \text{PSAR}_{t-1})Meanwhile, the calculation for a downtrend is
\text{PSAR}_t = \text{PSAR}_{t-1} - a_{t-1} (\text{EP}_{t-1} - \text{PSAR}_{t-1})The idea is to add +at-1(EPt-1 – PSARt-1) in an upward trend or subtract -at-1(EPt-1 – PSARt-1) in a downward trend, the expected result, to the previous Parabolic SAR value.
Where:
PSARt is the Parabolic SAR of the previous t.
PSARt-1 is the Parabolic SAR of the previous period t-1. Example: if today is day ten (or week ten), then t-1 is day nine (or week nine)
at-1 is the accelerating factor starts at 0.02, and in an upward trend, it will increase 0.02 every time there is a higher high, until 0.2; in a downtrend, it will increase 0.02 every moment there is a lower low, until 0.2.
EPt-1 is the lowest low for a downtrend or the highest high for an upward trend.
Python Example
Download Data and Parabolic SAR Estimation in Python
As in the previous example, the first step is to import the Python libraries:

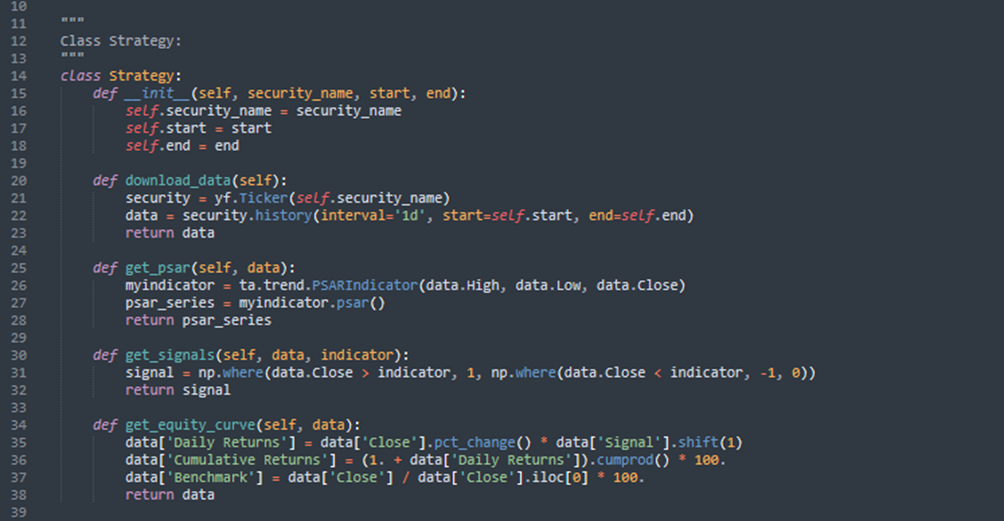
Then, we will implement in Python the Strategy class that has the following structure:
- A function to instantiate the initial parameters __init__
- A function to download data from Yahoo Finance download_data
- A function to calculate the Parabolic SAR indicator get_psar
- A function to calculate the entry and exit signal for the strategy get_signals
- A function to calculate the performance of the strategy get_equity_curve
The logical order is to download the data because, without data, it is not possible to do anything. Then, it is to estimate the indicator (Parabolic SAR). Next, it is to find the buy and sell signals. Finally, it is to calculate the performance of the strategy. The Strategy class follows this order.
The following image shows the initial parameters: the security “AGG”, the start date “2020-01-01”, and the end date “2023-01-01”.
