

How I Made A Profitable Chaikin Oscillator Trading Strategy In Python
Introduction
This tutorial will implement the Chaikin Oscillator in Python using historical financial data from the iShares Russell 1000 Growth ETF (IWF). The first part will briefly review the theory behind this indicator. The second part will code a trading strategy using this indicator in Python.
Related reading: – Many more Python trading strategies
Chaikin Oscillator Indicator
This indicator is an oscillator indicator because it measures the momentum of the Accumulation Distribution Line using the MACD. One aspect of the Chikin Oscillator indicator is that uses the values of another indicator as input. Marc Chaikin developed it in the 1970s.
The steps to calculate the Chaikin Oscillator are:
\begin{align*}
\text{(1)}\quad & \text{Money Flow Multiplier} = \frac{\text{Close} - \text{Low} - (\text{High} - \text{Close})}{\text{High} - \text{Low}} \\ \\
\text{(2)}\quad & \text{Money Flow Volume} = \text{Money Flow Multiplier} \times \text{Volume for the Period} \\ \\
\text{(3)}\quad & \text{ADL} = \text{Previous ADL} + \text{Current Period's Money Flow Volume} \\ \\
\text{(4)}\quad & \text{Chaikin Oscillator} = \text{3-day EMA of ADL} - \text{10-day EMA of ADL}
\end{align*}
We will explain with historical data each step of the Chaikin Oscillator calculation in the next sections.
Python Example
Download Data
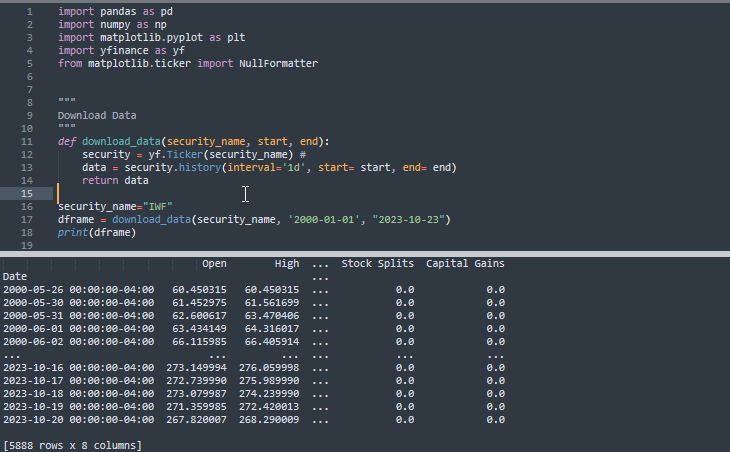
As in the previous tutorial, the first step is to import the Python libraries; and then, download the historical data associated with iShares Russell 1000 Growth ETF (IWF).
Steps to Calcualte Chaikin Oscillator Indicator
This part will go through the four steps to calculate the Chaikin Oscillator in Python.
The first step is to calculate the Money Flow Multiplier (Equation 1) as shown in the following images. The moneyFlowMultiplier function takes two parameters: a pandas data frame data and debug. The function body calculates and returns the indicator.

To provide a more in-depth explanation of the Money Flow Multiplier calculation using single dates, the following image illustrates the process when the debug = True. It prints the calculus for the rows 0, 1, 11, and 33.


The image below showcases the plot_data function, a tool for visualizing the intermediate series generated during the calculation of the Chaikin Oscillator.

After implementing the following code to plot the Money Flow Multiplier, the result will show an overcrowded image because the chart has over 20 years of daily data points.
