
SPY Strategies For Volatile Markets: Utilizing The VIX Indicator (Member Article)
Traders love to use technical indicators to generate signals and try to earn superior returns. One of those indicators is the VIX, which we will be using today. Let’s look at SPY strategies for volatile markets utilizing the VIX threshold.
Our backtest reveals that it’s most profitable to hold and own SPY when the VIX is high (above 29) based on risk-adjusted returns.
At the bottom of the article, you also find the complete Python code for this backtest.
Let’s explain the logic, trading rules, backtest, and results:
SPY Strategies for Volatile Markets: Utilizing the VIX Threshold – The Strategy’s Logic
The idea of the strategy we are going backtest is simple: holding onto SPY depending on what the VIX is up to.
More specifically, we will be looking at how the SPY performs when the VIX level is above or below a certain value.
Why might holding the SPY when the VIX is low work? Holding SPY when the VIX is below a certain level can be a good strategy since it indicates that the volatility is very low and the market is stable, contrary to a high VIX level, where there is a lot of volatility and uncertainty.
Moreover, in theory, it should eliminate the possibility of experiencing a large drawdown or a sharp decline.
However, a low VIX level is also associated with a stock market top, which could mean that stocks are overextended and due to a correction. The only way to discover which is which is to do a backtest and check the results.
SPY Strategies for Volatile Markets: Utilizing the VIX Threshold – trading rules
The trading strategy we are going to backtest is pretty simple:
Trading Rules
[am4show have=’p2;p3;p58;p59;p130;p138;’ user_error=’Premium Post Access’ guest_error=’Premium Posts’]
- We buy and hold the SPY when the VIX is below/above a certain value
- We sell the SPY when the VIX rises above/below that certain value
[/am4show]
We divide our backtest into two: hold and own SPY when VIX is below a certain level and when VIX is above a certain (threshold) level.
VIX Thresholds And Returns – Backtest
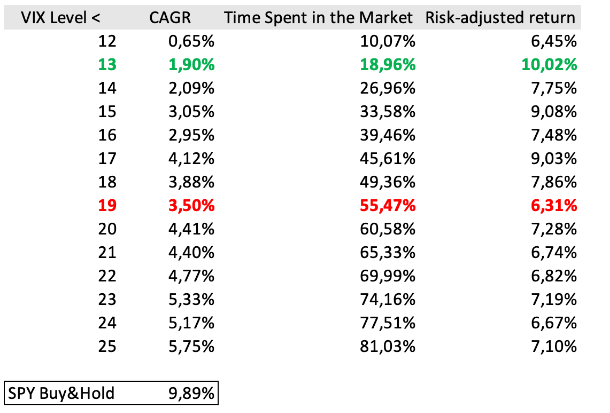
In the tables below we look at risk-adjusted returns, which is simply the CAGR (annual return) divided by the time spent in the market. The logic is simple: The most return in the shortest period of time is the most desirable.
Here is the table showing the results by VIX being below certain thresholds:
Here is the equity curve of the best and worst strategies:
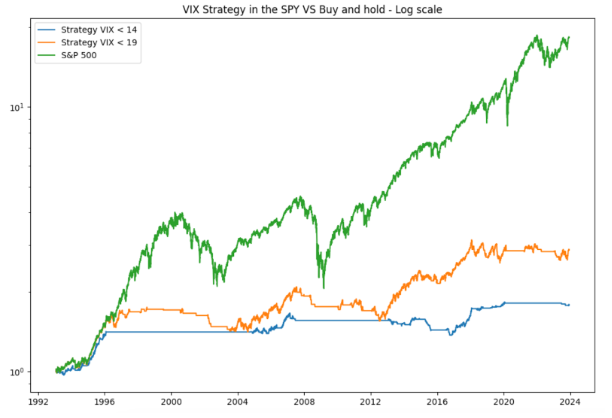
As you can see, none of the strategies generate super profitable results. It seems like a low VIX level has to do more with a market top than a continuation of an upside trend in the market.
Let’s go to backtest number two:
We also decided to test the inverse strategy: we buy and hold SPY when the VIX is above a certain level and threshold and sell it when it falls under that level. Here is the optimization table: