
Footprint Trading Strategy – What Is It?
Footprint trading strategy is a popular strategy used by traders to analyze and interpret order flow and volume data in financial markets. It provides valuable insights into the dynamics of buying and selling activities at each price level.
In this article, we will delve into the details of what we might call footprint trading, including the interpretation of footprint charts, identifying trading opportunities, analyzing delta footprint charts, implementing volume analysis, and tips for effective footprint trading.
What On Earth is Footprint Trading?
Footprint trading involves the analysis of order flow and volume data in real-time, displayed in a visual format known as a footprint chart.
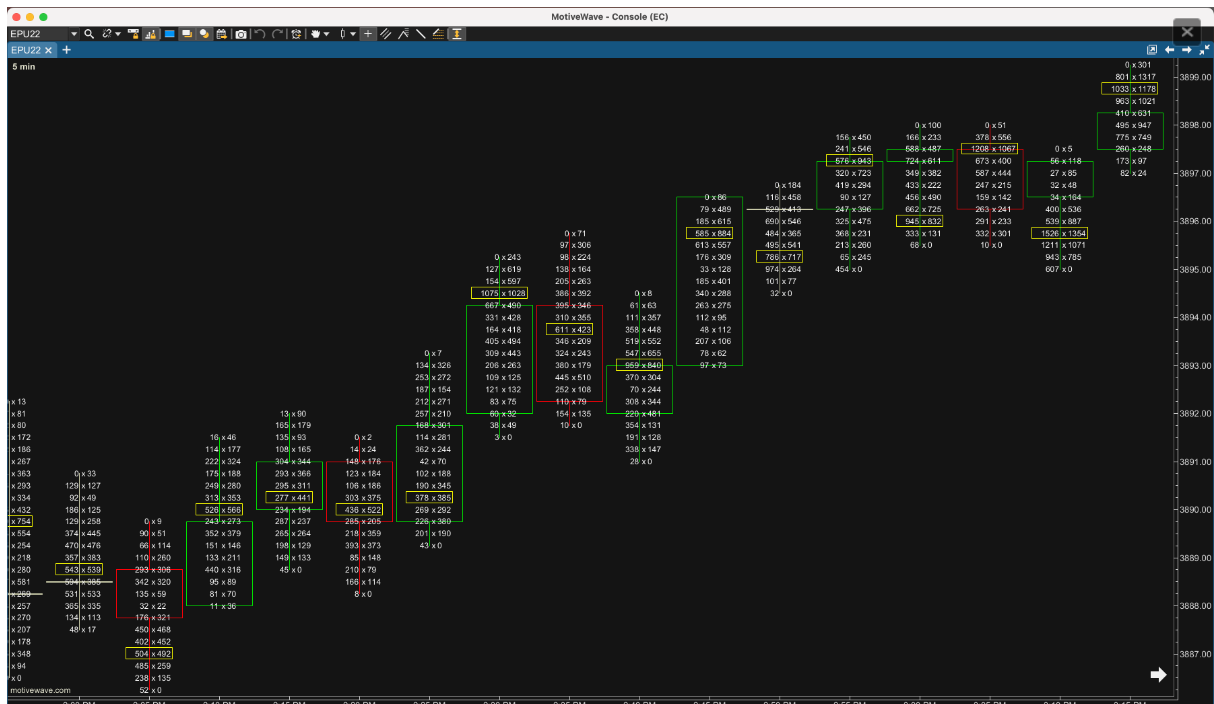
Above is an example of a footprint chart (courtesy of jumpstarttrading.com).
The footprint chart represents the buying and selling activity at each price level, providing a comprehensive view of market dynamics. Traders use footprint charts to identify trading opportunities and gauge market sentiment.
It might resemble a support and resistance trading strategy. However, it’s pretty cumbersome to backtest a footprint trading strategy because it requires a lot of trading rules.
Understanding the Footprint Chart
A footprint chart is a type of candlestick chart that displays the volume traded at each price level. It allows traders to observe the distribution of trading volume throughout the trading session and identify significant price levels, let’s call it support and resitance levels.
The chart provides a visual representation of the interaction between buyers and sellers, offering valuable insights into market dynamics.
How to Read Footprint Charts
Traders can read a footprint chart by analyzing the patterns of volume and order flow at different price levels.
Traders look for areas of high volume, stacked imbalances, and unfinished auctions, which can indicate potential trading opportunities. Understanding the distribution of volume and order flow presumably helps traders identify price levels where significant buying or selling activity is concentrated.
How to Use Footprint Charts for Trading Opportunities
Traders can employ footprint charts to identify trading opportunities by analyzing the order flow and volume dynamics in the market. They focus on identifying imbalances, using order flow analysis, and developing trading strategies based on the insights derived from the footprint charts.
Using Order Flow Analysis in Footprint Trading
Order flow analysis plays a crucial role in footprint trading, as it allows traders to interpret the interaction between buyers and sellers in real-time.
Traders analyze how orders are being executed, the aggressiveness of buying and selling activities, and the presence of significant market orders, all of which contribute to identifying trading opportunities.
Analyzing Delta Footprint Charts
Delta footprint charts provide traders with additional insights into the trading dynamics of futures markets. Analyzing delta footprint allows traders to interpret the difference between the volume traded on the bid and the volume traded on the ask, providing valuable information for making trading decisions.
Interpreting Delta Footprint in Trading Futures
When trading futures, interpreting delta footprint provides traders with information about the aggressiveness of buying and selling activities. By analyzing the delta footprint, traders can gauge the strength of the market participants and make informed trading decisions based on the imbalance between buying and selling pressure.
Utilizing Stacked Imbalances in Delta Footprint Analysis
Delta footprint analysis involves observing stacked imbalances, which indicate significant price levels where buyers or sellers are dominating the market. Traders can use this information to identify potential reversal points or areas of high trading activity, contributing to their trading strategies and decision-making process.
Uncovering Reversal Signals in Delta Footprint Charts
Delta footprint charts can reveal reversal signals that provide traders with valuable insights into potential t