
Pin Bar Trading Strategy (Statistics, Facts, & Historical Backtest)
Introduction to Pin Bar Trading:
A pin bar, short for “Pinocchio bar,” is a distinctive candlestick pattern frequently utilized in technical analysis within the realm of financial trading. It is characterized by a long tail or shadow and a small body, often resembling a pin or a nose. This pattern can be spotted on price charts and provides valuable insights into market sentiment.
The significance of a pin bar in trading lies in its ability to signal potential reversals or continuations in price trends. When a pin bar forms after a downtrend, with the long tail extending below the price action, it suggests a potential bullish reversal.
Conversely, when it occurs following an uptrend, with the long tail above the price action, it indicates a possible bearish reversal. Traders use pin bars as part of their technical analysis about entering or exiting positions in the financial markets, adding a valuable tool to their trading strategies.
Anatomy of a Pin Bar
The Anatomy of a Pin Bar involves understanding its essential elements and recognizing its bullish and bearish variations.
A Pin Bar is a candlestick pattern consisting of three key components:
- The Nose: This is the narrow segment at the center of the candlestick, representing a small price range during a specific time period.
- The Tail (or Shadow): The thin line extending from the top or bottom of the candlestick, indicating price rejection beyond the Nose. A longer tail signifies stronger rejection.
- The Body: The wide part of the candlestick, located opposite the Tail. It represents the opening and closing prices, with different colors for bullish and bearish bars.
Identifying a bullish Pin Bar:
- Look for a Pin Bar with a long tail extending below the Body.
- The Body should be small and situated at the top of the candlestick.
- It suggests a potential bullish reversal, with buyers gaining control.
Identifying a bearish Pin Bar:
- Observe a Pin Bar with a long tail extending above the Body.
- The small Body should be positioned at the bottom of the candlestick.
- It indicates a possible bearish reversal, with sellers gaining dominance.
For example, a pin bar might look like the two candlesticks in the rectangle (both a bullish and bearish pin bar):
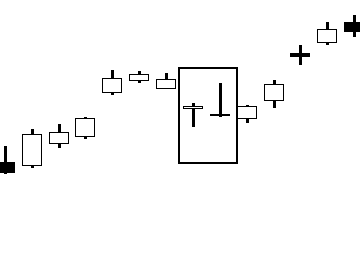
In summary, the anatomy of a Pin Bar involves the nose, tail, and body. Recognizing a bullish or bearish Pin Bar is based on the location and length of the tail relative to the body, helping traders anticipate potential price reversals.
Pin Bar Trading Strategies
Pin Bar Trading Strategies refer to a set of techniques used in financial markets to capitalize on pin bars, which are distinctive candlestick patterns indicating potential price reversals.
Let’s make a backtest based on the two Pin Bars. In practice, a bullish Pin Bar is almost similar to the Dragonfly Doji, while a bearish Pin Bar is similar to the Gravestone Doji.
We have backtested both of these in our candlestick course (we quantified all 75 candlestick patterns into plain logic in English plus we made code for Amibroker and Tradestation – click on the banner below for more info or order):

If we use the same trading rules as we did in our candlestick research report (click on the banner above) and backtest S&P 500 and its ETF (SPY) since its inception in 1993, we get the following results when backtesting the bullish Pin Bar trading strategy and hold for N-days:
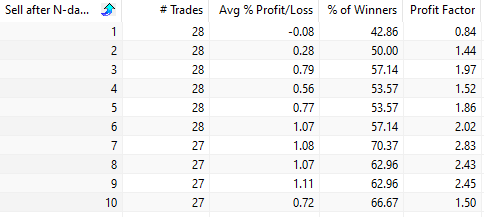
For example, if we hold for 6 trading days we get on average 1.07% in profits per trade, but it’s only 28 trades.
Conversely, with the bearish Pin Bar trading strategy we get the following results:
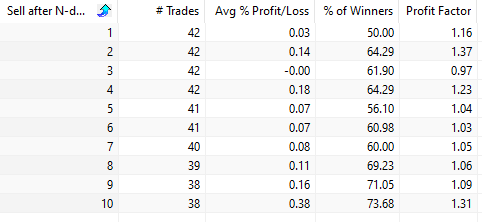
Clearly, the bearish Pin Bar strategy returns much worse results than the bullish Pin Bar trading strategy.