
January Barometer Stock Market Effects: Can January Foretell The Rest of the Year?
The January Barometer is a seasonal trading strategy that worked over many decades. While the traditional January Effect seems to be arbed away, the January Barometer has worked well for many decades. This is the January effect that works – the January Barometer. What is it all about? Let’s find out:
The gain in January determines the average gain for the next 11 months: If the S&P 500 declines in January, the average percentage change for the next eleven months is 3.3%. If the S&P 500 rises during January, the average percentage change in the next 11 months is 10.3%. This is the new January Barometer Stock Market Effect.
January Barometer – the January effect that works
We came across the January Barometer for the first time when we read the books from Victor Niederhoffer in the 1990s. He was one of the first quants to use systematic backtesting for all his trading strategies.
On pages 279-280 in The Education of a Speculator, Victor Niederhoffer explains his version of the January effect and sets forth that the gain in January determines the average gain for the next 11 months. The trading rules are like this:
- If the S&P 500 rises between January 1 and January 31, it is believed that the market will perform positively for the remainder of the year.
- Conversely, if the market performs poorly in January, it is believed that the remainder of the year will do the same.
Pretty simple rules!
Victor Niederhoffer’s book is old – published in 1997. Does Niederhoffer’s hypothesis still hold?
It does:
The equity curve below is 100 000 compounded when January showed a decline (entry is on the close of January, and the exit is at the close of December 11 months later), from 1960 until today:
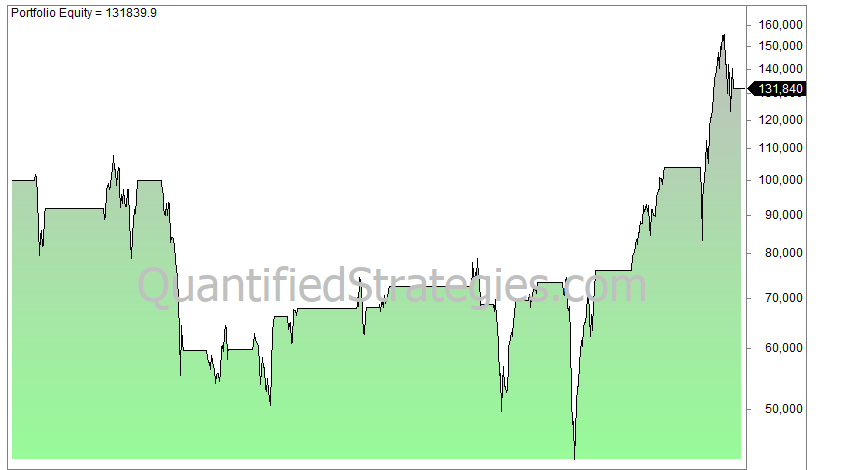
The first real drawdown happened in 1974, and the strategy never really recovered after that. The decade-long bull market of 2010-2020 made the strategy recover somewhat.
The reason for the poor performance is that during losing years, S&P 500 drops almost 16% on average, while the winning years rise only 13%. Hence, the risk and reward is poor.
But when January is positive, the equity curve improves substantially:
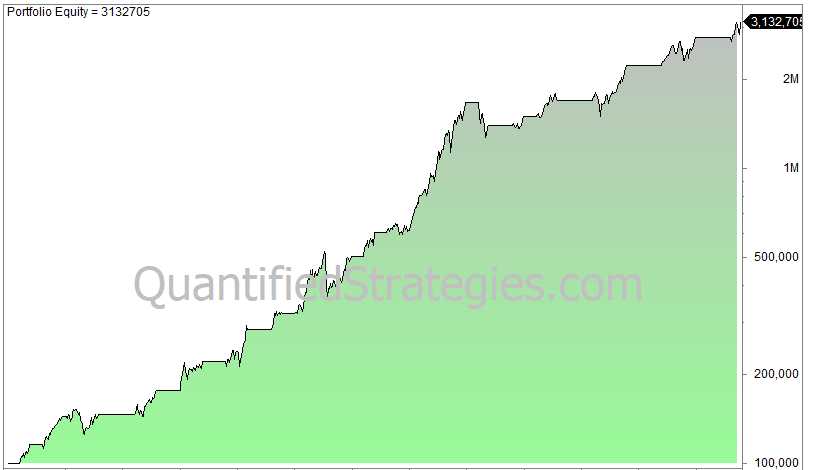
Quite a difference, to put it mildly. When January is up, the win ratio is 83%. When January is down, the win ratio drops to 62%. When January is up the average gain the rest of the year is 10.3% without even considering reinvested dividends (compared to only 2.6% when January is down).
The reason for the good performance when the January Barometer flashes a buy signal, is that losing years only drop 8% on average, while the winning years rise almost 15%.
The reason why this strategy seems to work is because of the occasionally large losers when January is down. For example, it happened in 1974 and 2008, two years which went on to fall substantially the rest of the year. When you avoid big drawdown you can start compounding from a higher level.
If you want to have the Amibroker or Tradestation code for the January Effect (and much of the code for our free trading strategies), please press this link:
