Do Candlesticks Pattern Work? Are They Reliable? A Quantitative Backtest Of 23 Candlesticks (Trading Strategy)
Candlesticks are a popular charting tool and are frequently used by promoters using anecdotal evidence. We use candlesticks in our charts ourselves, but not as a predictive tool in our trading strategies. In this article, we ask: do candlesticks work?
Yes, candlesticks work. We test 23 different candlestick patterns quantitatively with strict buy and sell signals. Perhaps surprisingly, some of the candlestick patterns work pretty well. Some of the patterns can highly likely be improved by adding one more variable. We provide the code for a small fee.
Candlesticks are a popular way to display quotes on a chart, something we have done since we read Gregory Morris’ Candlestick Charting Explained back in 1998. However, we have never implemented candlesticks in any of our quantified strategies.
Why do we use candlesticks in our charts? We agree with Mr. Morris, who writes this in the introduction of the book:
However, once you become accustomed to seeing Japanese candlestick charts, you will prefer them because their clarity is superior and allows a quick and accurate interpretation of the data.
Mr. Morris is right. Candlesticks are easy to digest once you get used to them. But do candlesticks have any predictive value? After all, we operate in the markets to make money, not to make nice visual graphs. Candlesticks might be popular, but we like to quantify to check for value.
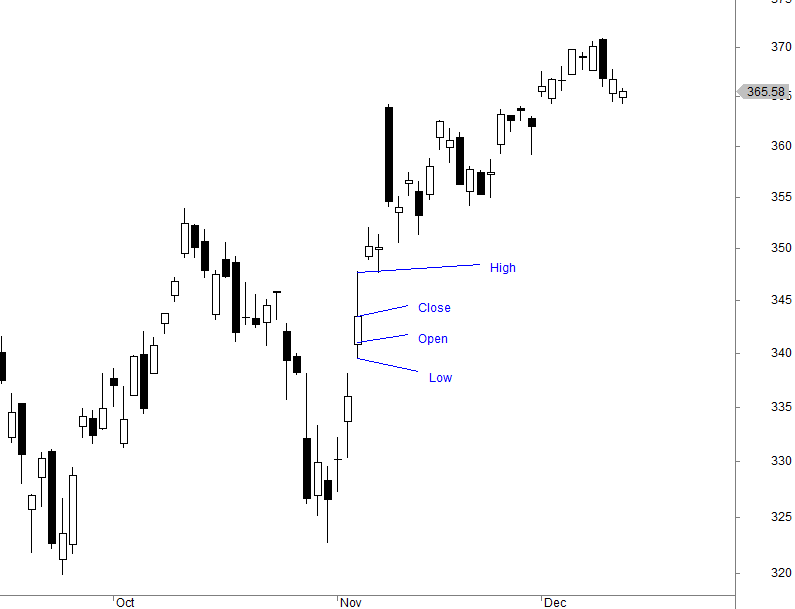
Candlesticks explained:
If you have never seen a candlestick, it might be a little confusing to start with, but once you get used to candlesticks, you get a much better visual look at the charts – for example, where the stock opened and closed. This is the primary reason, in fact, the only reason, why we use candlesticks when we look at charts.
A black candlestick means the open was higher than the close, while a white candlestick means the close is higher than the open. The difference between the open and the close is called “the body”. The “tails” on both sides are the high and low readings that day (or whatever time frame you are using):