
Trading SPY And S&P 500 Using VIX (VIX Trading Strategies)
Trading SPY And S&P 500 Using VIX (VIX Trading Strategies). The VIX is a popular measure of the implied volatility of S&P 500 index options. Put shortly, the VIX is a mean reversion indicator: when the risk premium increases (VIX is rising in value) it might be wise to buy stocks and sell when VIX drops in value.
In this article, we present several VIX trading strategies.
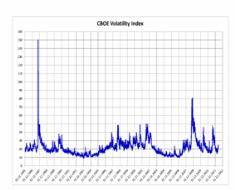
VIX vs SPY
Let’s start with a chart that shows the VIX and SPY (SPY is the ETF that tracks the S&P 500):
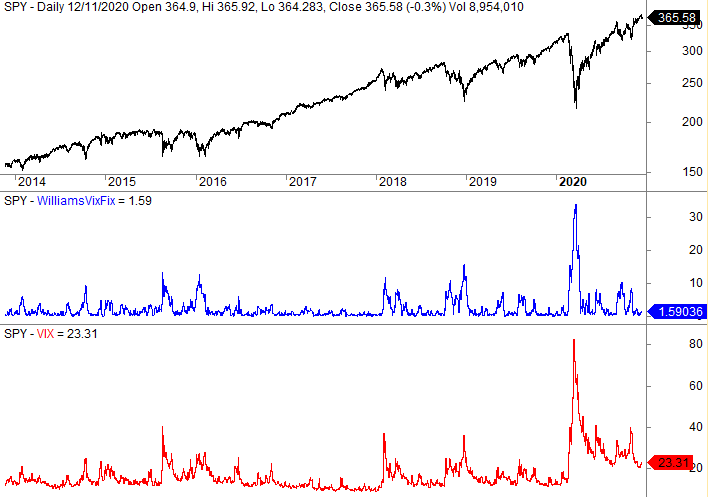
The lowest pane shows VIX (the blue line in the pane in the middle is a “synthetic VIX” called WilliamsVixFix). How does VIX affect SPY?
As you can see, the VIX goes the complete opposite way (negative correlation) compared to the stock market and it’s possible (of course) to make a VIX trading strategy based on the indicator. They are rarely both up and 99% of teh time the pattern is one of diverging paths.
VIX is a well-known indicator and a lot of strategies can be found on the internet. However, many of them are quite complicated. Personally, I have also tested a few of them.
VIX can also be traded. For example, the ticker VXX is an ETF for the short to intermediate volatility. However, an ETF can never replicate VIX completely and VIX is also a spot indicator.
Here is one idea to trade the VIX: Go long SPY/ES when VIX breaks the upper bollinger band (BB). Exit after two up days in SPY/ES (I have a fetish for this exit). I’ll test this in several versions: one going for the extreme fills, and others going for a lot more fills. The test period is from 2005 until July 2012.