6 Pivot Point Trading Strategies – Backtest, Definition, Formula, Analysis, and Performance
We have been investing and trading for about 21 years, but not until now have we ever looked at a pivot points trading strategy. We can read a lot about pivot points in certain media magazines and by stock commentators but have seen very little backtesting of any pivot point strategies. Below you find six backtested strategies:
This article presents several pivot points trading strategies, and we find no strategy that is close to being tradeable in the S&P 500, Nasdaq, Russell 2000, or the USD CFH forex market. We conclude that the pivot points are merely hyped and don’t serve many purposes except for creating more noise in the market. That said, a couple of day trading ideas can perhaps be worked upon.
We are reading Briefing In Play before the US open, and they have a dedicated website to pivot points. Admittedly, despite seeing pivot points being referred to every day before the markets open, we have basically no clue what pivot points really are.
But they must have some predictive value, right? Some weeks ago we reread The Day Trader – From The Pit To The PC by Lewis Borsellino and he wrote how he used pivot points before trading every day (by the way, this is a horrible book) without going into detail about what he really did. Borsellino was among the best and biggest pit traders in the S&P 500 in the 80s and 90s, and the markets have changed a lot since then.
When Borsellino made so much money, pivot points must be a very good indicator?
Let’s start by explaining what pivot points are:
What are pivot points?
The main pivot point is the average price of the high, low, and close from the previous trading day. Presumably, any trading above this point is bullish, and bearish if below.
From this pivot point, we can derive many others pivot points both above and below that main point. These can be support and resistance lines.
Pivot Points Formula
To backtest pivot points we need to define some simple rules. We did the following:
- C[1] is yesterday’s closing price
- H[1] is yesterday’s high, and
- L[1] is yesterday’s low
From this formula and three variables, we made the following five pivot points:
- Central pivot point P = (H[1] + L[1] + C[1]) / 3
- First resistance R1 = (2*P) – L[1]
- First support S1 = (2*P) – H[1]
- Second resistance R2 = P + (R1 – S1)
- Second support S2 = P – (R1 – S1)
However, after searching the web there seem to be several ways to calculate pivot points. But we stick to our definition above.
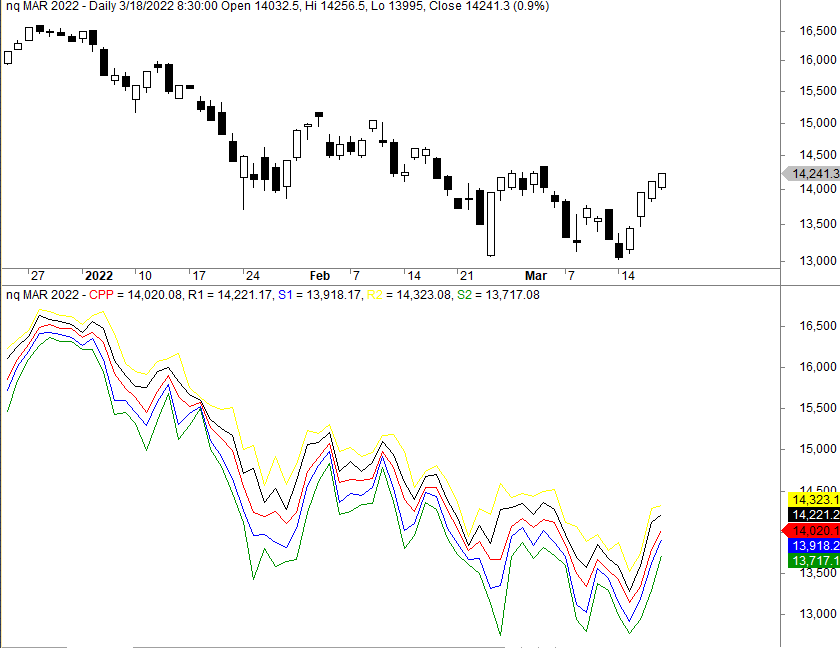
In Amibroker, the pivot points defined above look like this on the NQ (Nasdaq) futures: