Failed Bounce Trading Strategy – (A Failed Bounce Often Precedes Rising Prices)
The failed bounce trading strategy: Rob Hanna at Quantifiable Edges had an interesting article some days ago about bounces in the S&P 500. Let’s test his idea and turn it into a testable hypothesis:
(This article was first published in 2012. Since then, we have updated the charts, and the strategy is still performing well.)
The failed bounce trading strategy video
The failed bounce trading strategy
Why was it called the failed bounce strategy? We are not sure and frankly have no clue. But the name doesn’t matter, and the strategy is very good.
Trading rules
Let’s go straight to the trading rules, which we present in plain English:
(I changed Hanna’s strategy and ended up with these simple rules for the failed bounce trading strategy.)
- Yesterday’s IBS (Internal Bar Strength) was at least 0.6 or higher.
- Yesterday’s low was lower than the lowest low during the five days before.
- Today’s close is lower than yesterday’s close.
- Exit when the close is higher than yesterday’s high.
Trading performance and statistics
When we plot the code into Amibroker, we get the following statistics and performance metrics (the most important metrics are underlined in blue) when we backtest the ETF with the ticker code SPY – the ETF that tracks S&P 500:
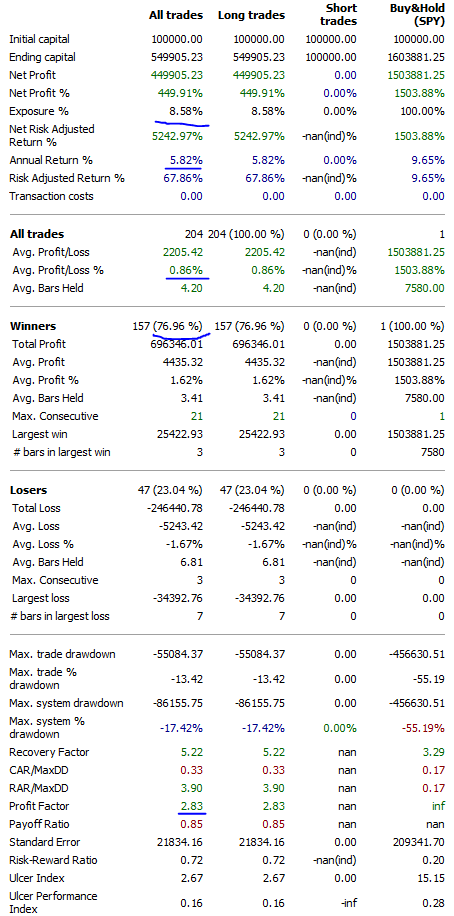
The trading statistics are good: the 204 trades returned an average of 0.86% per trade, and 77% of the trades turned out to be winners. Net profit is 450%, and the annual return is 5.8%.
We get these solid results despite being invested only 8.5% of the time. That equals a risk-adjusted return of 67%! The performance is excellent for such a simple concept, although the strategy has recently weakened.
Does the strategy work on other ETFs or futures? It does! But it works only on stocks, not commodities or bonds.
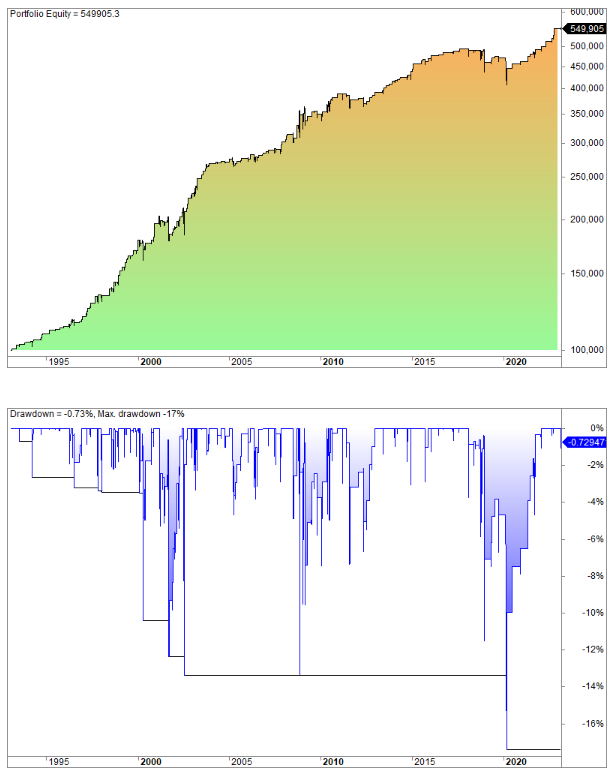
The equity chart looks like this for the failed bounce trading system: