
All-Time High Trading Strategy For Stocks (Frequency)
The stock market has been on fire for the last decade, causing the impression that it reached an all-time high almost every day. However, this is only a perception because all-time highs are quite uncommon. Let’s make an all-time high strategy for stocks.
The S&P 500 spent less than a tenth of its time at all-time highs since 1950. The average number of all-time highs per year is almost 21. But despite this, it has produced decent returns for investors.
In this article, we are going to look at how often the S&P 500 is at all-time highs, what this means to investors, and develop and backtest a trading strategy that takes advantage of all-time highs.
We also remind you that we have written hundreds of other valid trading strategies.
How often does the market hit all-time high?
From 1950 till 2022, the S&P 500 has set 1526 all-time highs along its path to the current level. That is an average of just under 21 times per year or about 8.3% of all trading days.
Here is a chart that shows every time the S&P 500 hit an all-time high by year since:
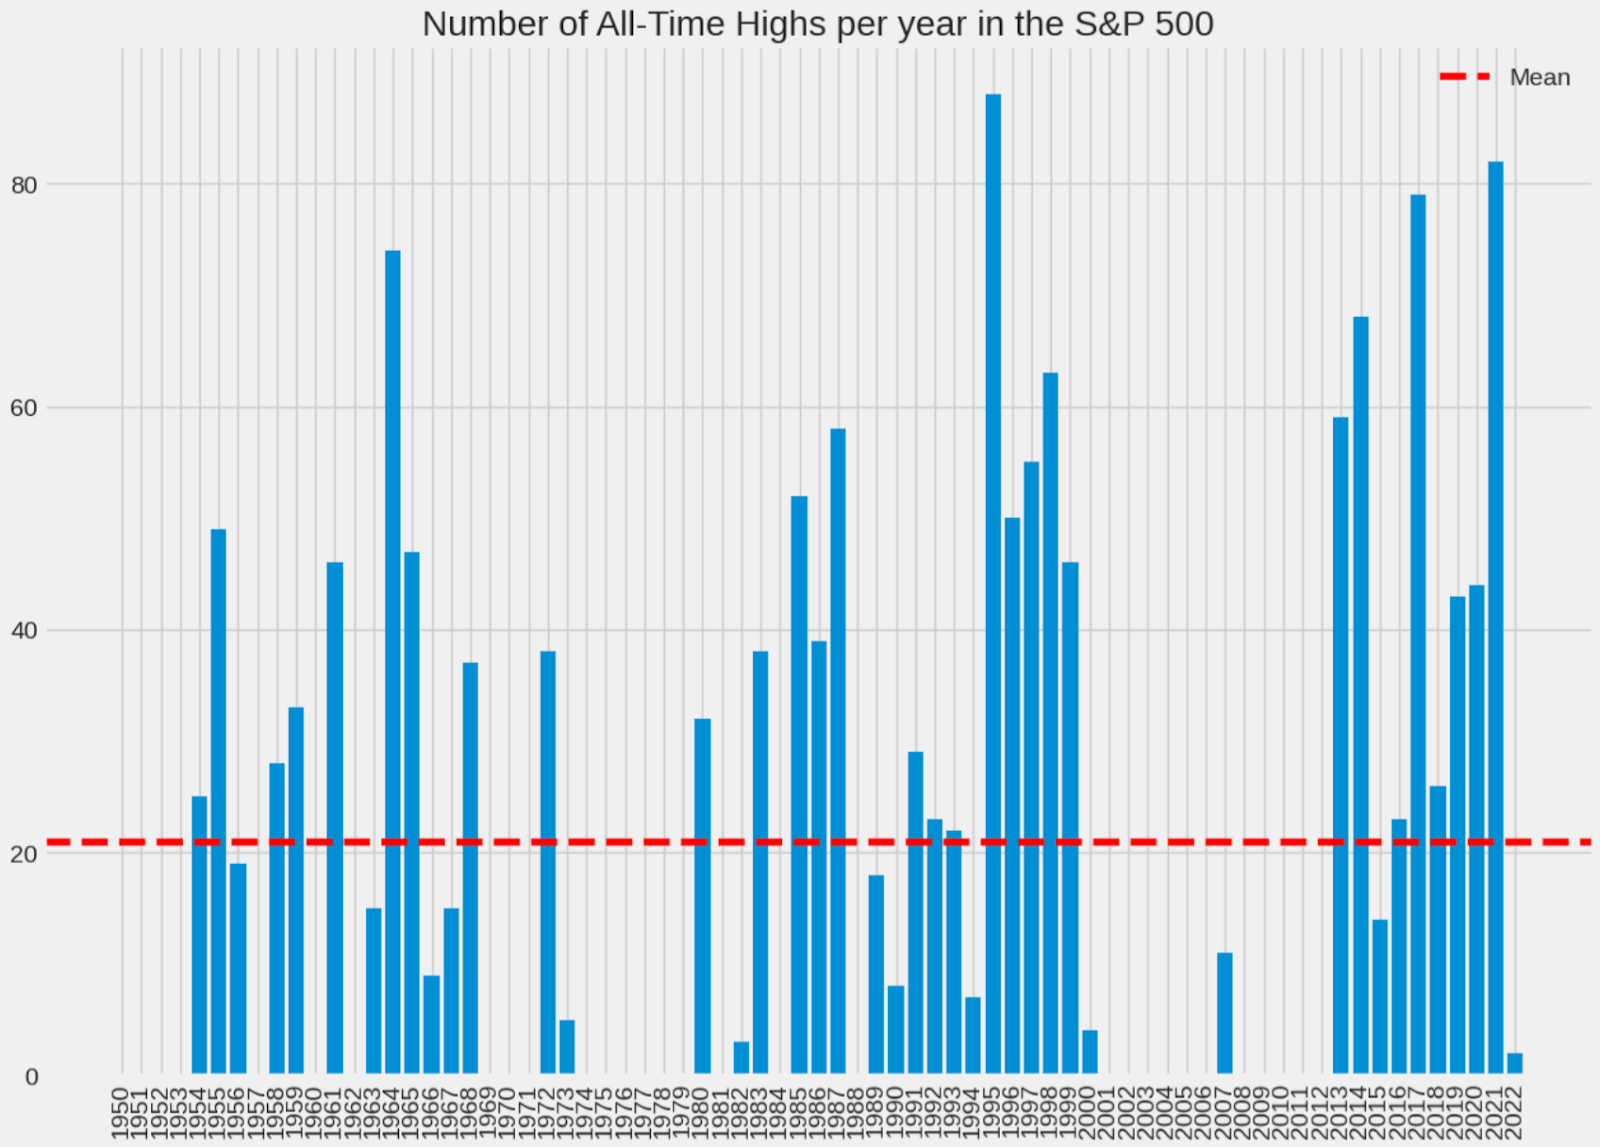
In other words, the market traded UNDER at its all-time high 91.7% of the time. This is a mind-blowing piece of data considering the return it has achieved during this time frame. Since 1950, the S&P 500 has compounded money at a 7.67% CAGR (no dividends, you can probably add about 2% including dividends).
The longest streak of consecutive years with the S&P 500 setting at least one all-time high is twelve, beginning in 1989 and finishing in 2000. The market has currently been making all-time highs for ten consecutive years, but 2023 threatens this streak.
What does an All-Time High in stocks mean for investors?
Generally, when the market reaches a new all-time high, it means that business is booming, earnings are up, momentum is high, and the market sentiment is high (perhaps euphoric). It also plays a very important psychological role because it increases the bullish sentiment among traders and investors since they are all making money. We believe FOMO – the fear of missing out – is also in play.
All-Time high and the inflation rate – adjusted data
We said generally because this is not always true. The stock market is constantly making new highs in countries with high inflation, such as Argentina or Zimbabwe. But if we were to adjust the inflation price, or even use US dollars instead of the local currency, you would see that the market is a steep drawdown from its high.
However, after an all-time high, the market tends to perform well during the following year rather than correcting and falling. This is the trend following and momentum in its maximum expression.
All-Time high trading strategy – backtest and performance
Can we develop a strategy to trade the All-Time high profitably? We are going to try. T