Andrews Pitchfork Trading Strategy — What Is It? (Backtest, Example, and Performance Insights)
If you are a fan of channel trading techniques, then you will definitely want to know about this old forgotten trading technique that projects potential support and resistance lines known as Andrews Pitchfork. You may be wondering what that is:
The Andrews Pitchfork trading strategy is a channel-based analysis technique developed by Dr. Alan Andrews. It is a popular trading tool that uses three to five parallel lines to find sharp trading opportunities. The middle line is called the median line, and there are two consecutive resistance trendlines above it and two consecutive support trendlines below it, which are potential reversal levels.
Let’s take a look at this trading method and the technical tool for it. At the end of the article we try to make a backtest of the indicator.
What is the Andrews Pitchfork trading strategy?
Developed by Dr. Alan Andrews, the Andrews Pitchfork trading system is an old trading technique that projects potential support and resistance lines. It is a channel-based analysis technique that uses three to five parallel lines to find sharp trading opportunities. The middle line is called the median line, and there are two consecutive resistance trendlines above it and two consecutive support trendlines below it, which are potential reversal levels.
The Andrews Pitchfork trading system is based on the general theory that if the price gets through the median trend line, about 80% of the time, it would retest the top of the Andrews Pitchfork channel.
On the flip side, if it gets below the median trend line, it would retest the bottom of the Andrews Pitchfork channel. Being a trading channel, the system follows the price trend.
Since the price tends to be mean reverting by nature, just like any other time series, when using the Andrews Pitchfork trading system, you notice that the price tends to gravitate toward the median line. So, the median line serves as both support and resistance — in other words, it can be seen as a regression line.
In essence, the Pitchfork trading system combines three of these powerful trading systems into one simple method:
- The support and resistance system
- The trend-following system
- The mean-reversion system
On a long-term basis, Andrews’ Pitchfork can be used to identify and gauge overall cycles that impact underlying spot activity. As we stated earlier, Andrews believed that market price action would gravitate toward the median line 80% of the time, with wild fluctuations accounting for the remaining 20%. Thus, the overall longer-term trend will (in theory) remain intact, regardless of the smaller fluctuations.
If sentiment changes and supply and demand forces shift, prices will stray, creating a new trend. You can increase the accuracy of these trades by combining Andrews’ Pitchfork with other technical indicators.
Before we continue with the strategy, let’s define what the technical indicator is and how to apply it to a trading chart.
What is the Andrews Pitchfork indicator?
The Andrews Pitchfork indicator is a technical tool for drawing the price channel in a trending market. Depending on the trading platform, the Andrews Pitchfork indicator may consist of three or five parallel lines, with the middle line being the median line. For example, in TradingView, it consists of five lines, while in MT4, it has only three lines. See a TradingView chart showing the indicator below:
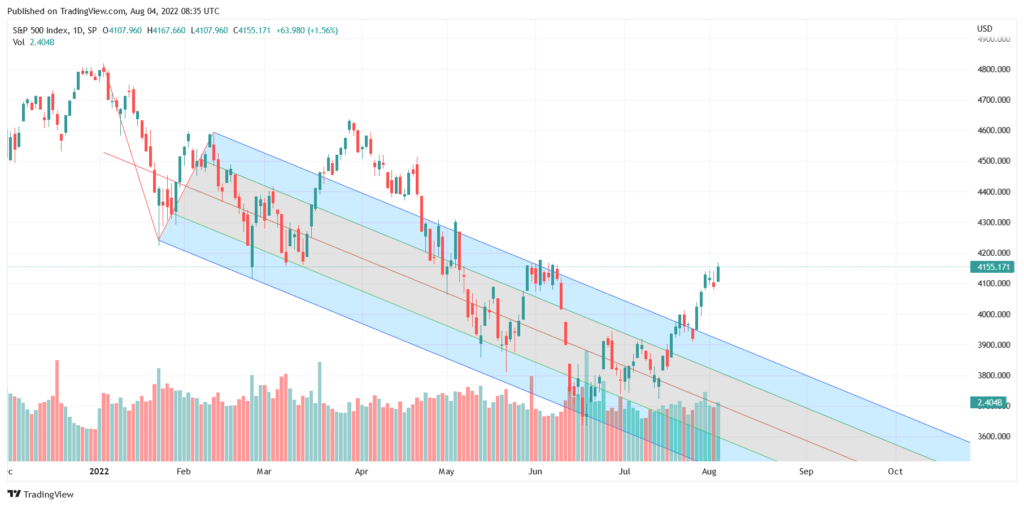
The middle line is the median, around which the price tends to swing about, serves as a pseudo-regression line. The two parallel lines above the median serve as resistance levels, while the two parallel lines below serve as support levels. The reason the indicator is called a “pitchfork” becomes apparent from the shape that is created in the chart. The indicator is constructed from three consecutive highs or lows on a chart. For an uptrend, the indicator is constructed from a low and high and then a low in that order. For a downtrend, the pitchfork is constructed from a high, a low, and then a high in that order.
The price tends to reverse on crossing the outer lines of the channel. Thus, the tool is used for trend trading to predict market reversal levels. The pitchfork shows continuous points of support and resistance. It shows the channel within which the price is likely to trade most of the time until the trend is seen to have reversed.
The Andrew Pitchfork indicator is available on numerous programs and charting packages and is widely used by both novice and experienced traders. The tool allows traders to trade channels when the market is trending by helping them to identify market corrections that you can use to time your entry to a trade. One can buy when the price tests the lower outer line and reverses and sell around the median line or the upper lines.
How to draw Andrews Pitchfork channel
If you want to apply Andrew’s Pitchfork on a chart, you need to identify the early stages of the trend and locate the pivots you want to apply it to. If it is an uptrend, your pivots would be consecutive low, high, and low. For a downtrend, your pivots would be consecutive high, low, and high.
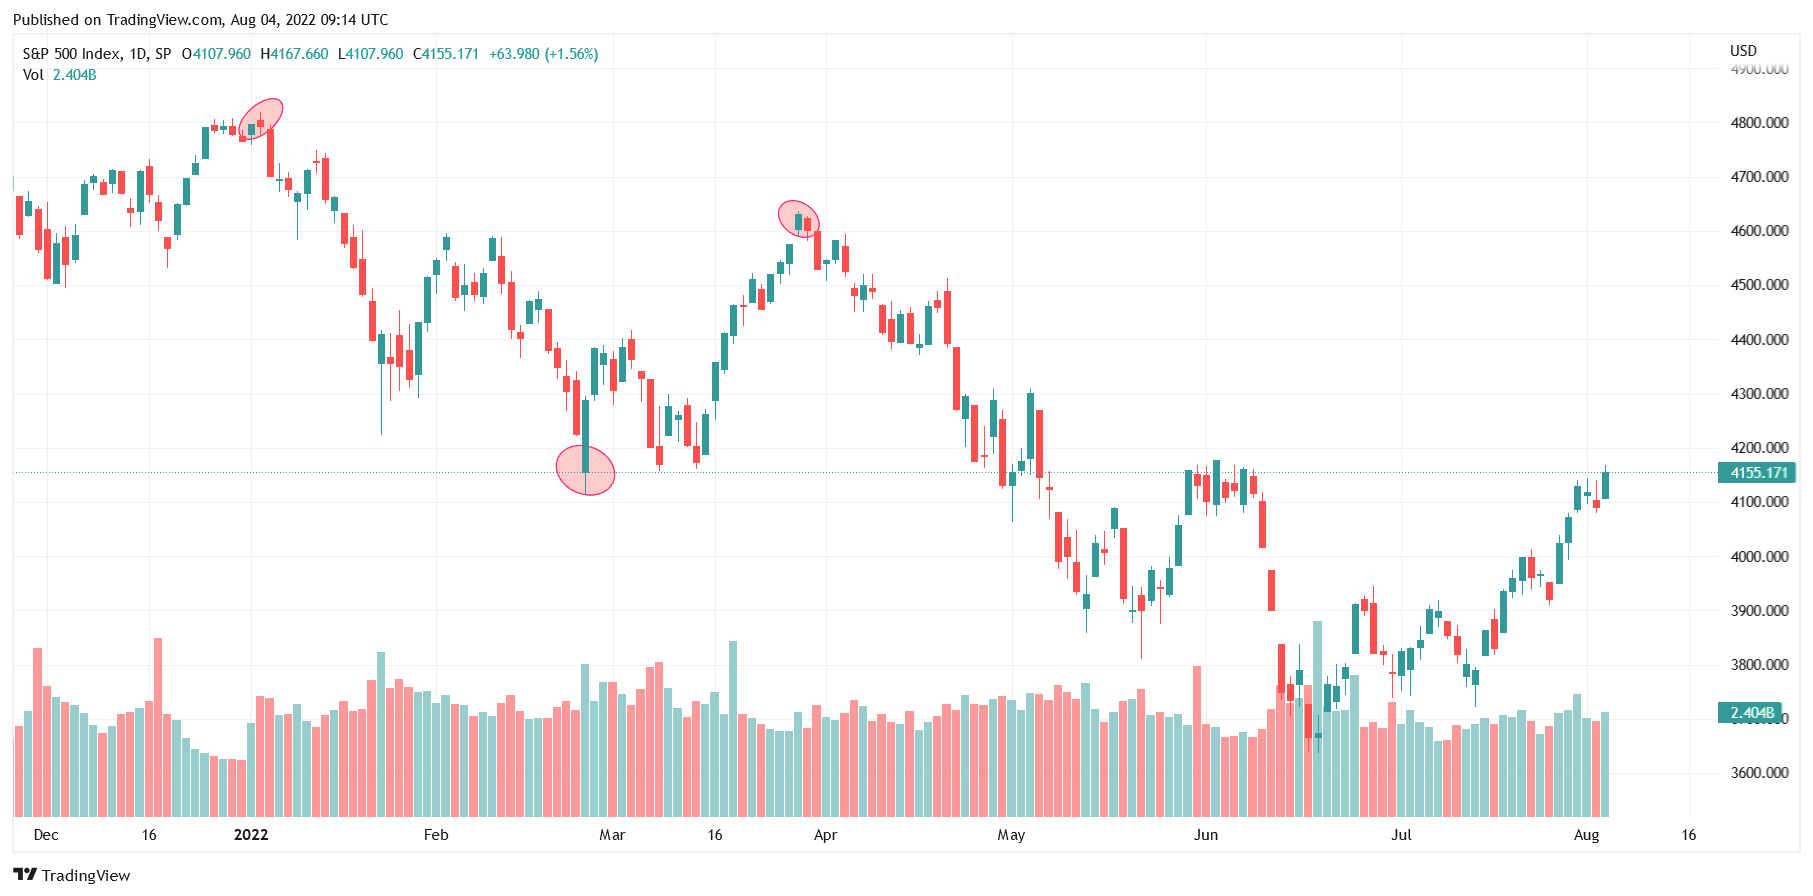
Mark these so-called pivots or turning points on the chart. The key points are highlighted in the chart below: