
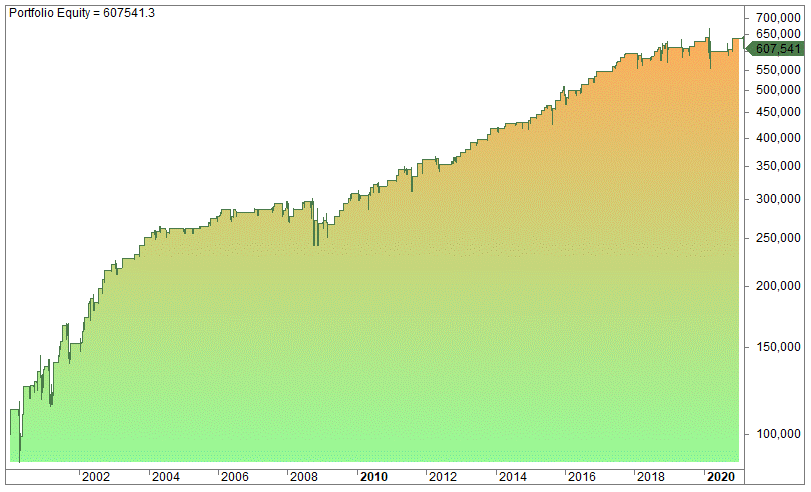
Average True Range Trading Strategy (Best ATR Indicator, Settings and System) – VIDEO
The ATR indicator is useful on its own and can be used to develop an Average True Range trading strategy. The Average True Range (ATR) was developed by Welles Wilder in the 1970s. In his famous book called New Concepts in Technical Trading Systems, published in 1978, Wilder also published the RSI and the ADX indicators.
In this article, we look at the Average True Range (ATR) indicator. We explain what the Average True Range indicator is, how it works, how you can use it, and if it’s possible to make profitable strategies by using the ATR. We show you why ATR is a useful indicator.
Welles Wilder was ahead of his time, this was well before the computer age, and all his indicators have stood the test of time and are still widely used. To this day, the RSI is probably the most popular trading indicator on the planet.
What is the Average True Range (ATR indicator)?
The Average True Range is a mathematical indicator that sets to measure the range of price changes. The ATR is calculated in two steps – the true range and the average of the true range:
How to calculate the True Range
The true range is the greatest of these three calculations:
- High minus the previous close
- High minus low
- The previous close minus low
How to calculate the Average True Range
When we know the true range of each day/bar, the range is calculated by using x-day/bar of the maximum range every day.
In this article, we use the in-built ATR in Amibroker, which is based on the original formula by Wilder in the book mentioned above. Wilder used a smoothed moving average that was built upon an exponential moving average. Read more here for the difference between simple and moving averages:
The Average True Range is a volatility measure
As you might have guessed the ATR is first and foremost a volatility measure that gives you no clue about the direction of the price: it could be up or it could be down. However, volatility normally picks up when the markets are uncertain.
The chart below shows the 15-day ATR in QQQ (Nasdaq):
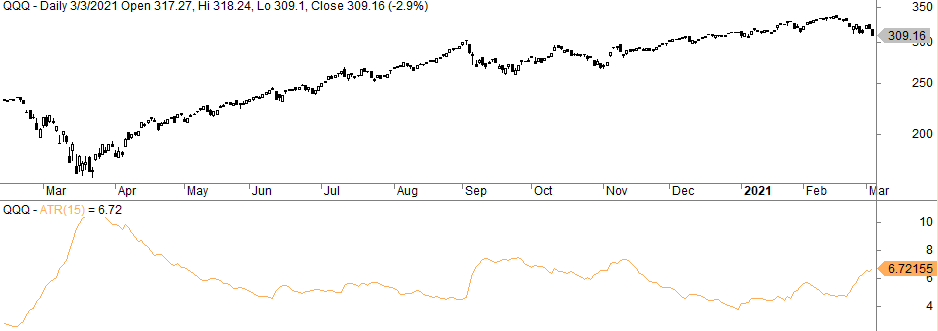
During the Covid-19 in March and April 2020, the volatility was very high but has since then cooled off.
How to use the Average True Range indicator
There are many ways to use the ATR. Below you find the four most obvious ways to use ATR: