
Bearish Abandoned Baby Candlestick Pattern | (Statistics, Facts, & Historical Backtest)
The Bearish Abandoned Baby pattern is a bearish reversal candlestick formation that appears in an uptrend and signals a potential trend reversal. This pattern is characterized by a gap up, followed by a Doji candlestick with a gap down, creating the appearance of an “abandoned baby.”
In this article, we will delve into details about the Bearish Abandoned Baby pattern, exploring what it is and how to identify it. We will also discuss how to interpret this pattern in the context of the market and understand the psychology behind it.
Additionally, we will explore some trading strategies for using the Bearish Abandoned Baby pattern as a signal and address the risks and limitations of relying on this pattern in trading.
What Is A Bearish Abandoned Baby Pattern?
A Bearish Abandoned Baby is a candlestick pattern that appears in financial market charts such as forex, stock, and futures markets. It is a bearish reversal pattern, which means it suggests that the current uptrend may be coming to an end and that prices may start to decline.
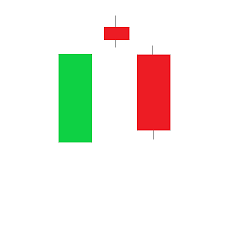
The pattern is characterized by three candlesticks. The first candlestick is a large bullish candlestick, followed by a Doji candlestick. The Doji is a candlestick with a small body with virtually equal upper and lower shadows, indicating indecision or a balance of buying and selling pressure. The third candlestick is a large bearish candle that opens slightly above the high of the first candlestick and closes below the low of the Doji candlestick. (See graphical presentation below.)
The Bearish Abandoned Baby pattern gets its name from the fact that the Doji candlestick is “abandoned” between the two large bullish and bearish candlesticks, which are like the “parents” of the Doji. This pattern is considered bearish because it indicates that the bulls (buyers) initially had control and pushed prices higher, but the bears (sellers) were able to gain control and push prices back down.
Identifying The Bearish Abandoned Baby Candlestick
To identify a Bearish Abandoned Baby candlestick pattern, traders typically look for the following characteristics:
- The first candlestick is a large bullish candle usually depicted in white or green. This candlestick should have a large body, which means the open and close prices are significantly different. The large body of the candlestick indicates that the bulls (buyers) were in control and pushed prices higher.
- The second candlestick is a Doji candlestick. As mentioned earlier, a Doji has a small body with virtually equal upper and lower wicks, indicating indecision or a balance of buying and selling pressure. The Doji candlestick should open and close at or very close to the same price.
- The third candlestick is a large bearish candle, usually depicted in red or black. This candlestick must close within the body of the first candle (the bullish candle). It opens slightly above the high of the first candlestick and closes below the low of the Doji candlestick. This indicates that the bulls initially had control, but the bears were able to push prices back down.
To confirm the Bearish Abandoned Baby pattern, traders typically wait for the price to break below the low of the first bullish candlestick, this is considered a bearish breakout. Some traders may also use other technical indicators, such as volume or momentum, to confirm the pattern.
It’s important to note that the Bearish Abandoned Baby pattern is just one candlestick pattern among several others that traders can use in their analysis and is not a guarantee of future price movements. It’s always important to use multiple technical and fundamental analysis techniques and consider the overall market context when making your trading decisions.
To better understand what the pattern looks like let’s show you a graphical presentation of Advance Block.
The pattern can look like this:
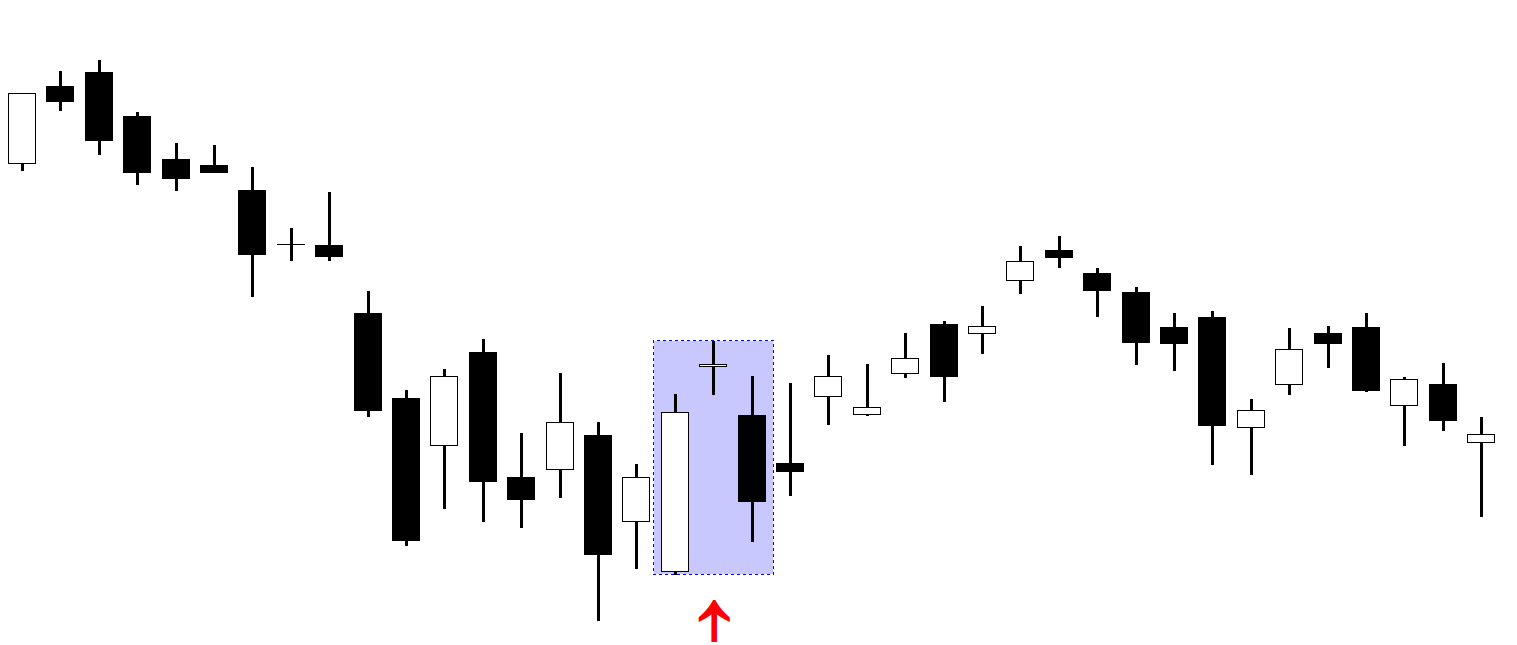
If we zoom out such a pattern can take a form like this:
Bearish Abandoned Baby Candlestick Pattern Backtest
We recommend backtesting all your trading ideas – including candlestick patterns.
To backtest candlestick patterns, you need to set specific rules and definitions. That requires time and effort, but don’t worry: it’s already done for you!