

Bearish Belt Hold Candlestick Pattern: (Statistics, Facts, & Historical Backtest)
The Bearish Belt Hold candlestick pattern is one that has been around for a while. It’s not one of the common ones, but it still has a sizeable number of fans among candlestick pattern traders.
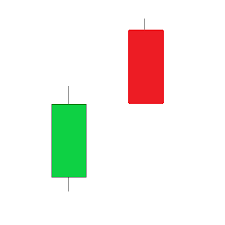
A Bearish Belt Hold is a bearish candlestick pattern that appears in an uptrend and indicates a potential trend reversal. It comprises a long red or bearish candlestick that opens with a noticeable gap from the closing of the previous bullish candlestick.
This pattern is seen as a warning sign for traders, as it may indicate a shift in market sentiment and a potential trend reversal. However, it’s not so cut and dry, as this pattern alone is not enough to predict a reversal.
In this article, we will explore the characteristics and significance of the Bearish Belt Hold and discuss several concerning issues and mind-boggling questions that surround traders’ use of this candlestick pattern. Here’s everything you should know;
What is a Bearish Belt Hold Candlestick Pattern?
A Bearish Belt Hold candlestick is used to identify potential bearish trends or reversals in a market.
The pattern comprises a single candlestick with a significant downward movement and a small upper shadow. This indicates that the market opened at a high price but quickly dropped and remained at a lower price for the rest of the trading period. The small upper shadow suggests some buying pressure, but it was not enough to push the price back up.
The Bearish Belt Hold pattern is often seen as a sign of weakness in the market and is used by traders to take a bearish stance or exit long positions. It may also signify that a reversal is imminent, as the market cannot sustain the high price and falls back down.
Traders should be cautious when interpreting this pattern, as it can sometimes be misleading. The Bearish Belt Hold would best work with other market confluence like the upper trendlines, major areas of resistance, momentum, and multiple timeframe analysis. It is essential to consider other market factors and to confirm the pattern with other technical analysis tools before making any trading decisions.
What are the characteristics of a bearish harami candlestick pattern?
The pattern can look like this:
If we zoom out such a pattern can take a form like this: