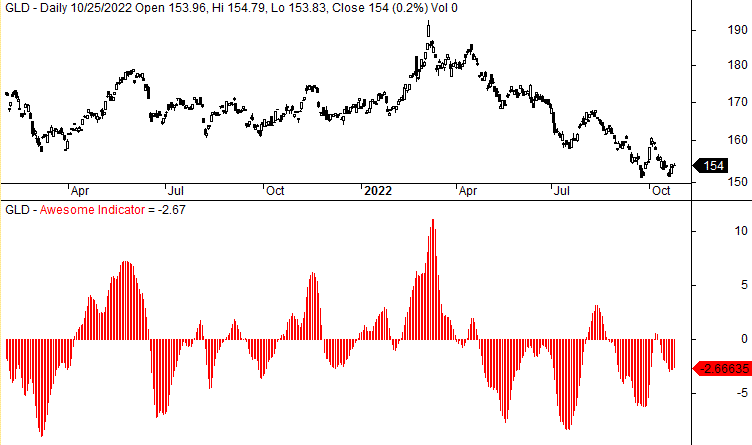
Bill Williams Awesome Oscillator Strategy Unveiled
Williams stated in his book, “It is, without doubt, the best momentum indicator available in the stock and commodity markets. It is as simple as it is elegant.” That’s a bold statement. What is in Bill Williams Awesome indicator?
The Bill Williams Awesome oscillator is an indicator that traders use to measure momentum in a market with the aim of detecting potential trend direction or trend reversals. It is basically a 34-bar simple moving average subtracted from a 5-bar simple moving average.
Like all indicators, it is typically used as part of a larger trading system to formulate a strategy. Now, let’s take a look at the indicator. At the end of the article, we make a backtest of Bill Williams Awesome indicator.
What is Bill Williams Awesome oscillator?
The Bill Williams Awesome Oscillator is a technical analysis indicator created by American trader Bill Williams as a tool to determine whether bullish or bearish forces dominate the market.
Traders use it to measure momentum in a market with the aim of detecting potential trend direction or trend reversals. The indicator measures momentum by comparing recent market movements to historic market movements.
It does this by combining a shorter-timeframe and longer-timeframe simple moving averages; in other words, it considers the recent momentum in comparison with a higher timeframe momentum. Like all indicators, it is typically used as part of a larger trading system.
The Awesome Oscillator is plotted in its own window at the bottom of the chart and has a zero line much like many other oscillators. It uses the 34 simple moving average and the 5 simple moving average in its calculation; however, the moving averages that are used to calculate the indicator reading aren’t the conventional moving averages that people will use as they don’t measure the close of the candlestick, but the midpoint of the candlestick range.
The indicator measures the difference between the two moving averages and plots them in a histogram.