
Bollinger Bands Trading Strategies | Are %B Systems Profitable in 2024? (Backtest And Performance)
Can we make a profitable Bollinger Bands trading strategy? The Bollinger Bands are renamed after its inventor, John Bollinger. The indicator was invented in 1980 and made John Bollinger a pretty famous trader. The bands are included in all software platforms and frequently mentioned in the financial media. What is all the fuzz about? Are Bollinger Bands profitable?
We conclude that Bollinger Bands are somewhat profitable in the stock market, which is a market that is very mean-revertive. We tested some ideas for Bollinger Band trading strategies, and it seem to work as a breakout indicator in gold. However, we didn’t manage to find any useful Bollinger Bands strategies for stock indices.
If you find this article useful, you might want to have a look at our landing pages for a lot of other trading strategies and edges:
Thus, you have three bands:
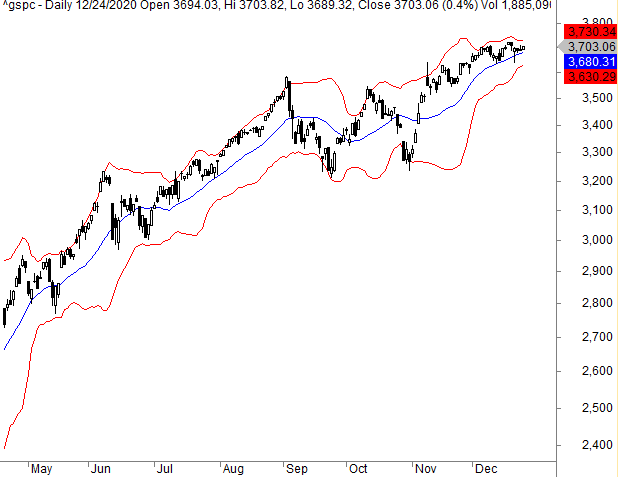
The above chart shows the 20-day simple moving average (the blue line), and the red lines above and below are added and subtracted 2 standard deviations from the moving average.
In times of high volatility, the bands expand. In times of low volatility, the bands contract. Why do they expand and contract? This is because the bands react to the volatility of the share price – the standard deviation:
What is the standard deviation? How do we calculate the Bollinger Bands?
The standard deviation is a statistical term used to measure the volatility in a sequence of numbers. For stocks, the sequence of numbers is, of course, the stock price.
A coin flip better explains how the standard deviation works:
If you flip a coin, the random nature means a 50% chance of either heads or tails. However, over many flips, it might not be 50% each. If you toss the coin 100 times, it’s actually more likely it will not be 50% evenly distributed.
If we use the computer to generate 1 000 sets of 100 flips each, the result would resemble the famous bell curve. The majority of the flips are around 50:50 and less as we go toward 51:49, 52:48, 53:47, etc.
A standard deviation is a way of quantifying the likelihood of “extreme” events away from the mean, which in this case is 50:50. One standard deviation is the square root of the variance.
The more standard deviations we use, the more the upper and lower bands deviate from the mean. One standard deviation is expected to contain 67% of the observations, while two standard deviations contain 95% of the observations. Three standard deviations contain 99% of the observations.
In the example above with the coin flips, one standard deviation is the square root of the sample size (100) divided by two. This equals 5. Hence, 67% of the time we can expect the coin flips to be within 55:45 and 95% of the time within 60:40. There is only a one percent chance of getting 65:35 or more.