Bottom Timing Trading Strategy For SP 500 (Statistics, Facts, & Historical Backtest)
Finding a bottom timing trading strategy for the stock market is one wet dream for many traders. Unfortunately, only a few manage to nail the exact bottom. We suggest another type of strategy:
We find that buying the S&P 500 some time after the official start of a recession generates an average return of 22% one year after.
In this article, we’ll show you a bottom timing trading strategy for SP 500, complete with trading rules, backtest, and Python code.
We also remind you that this is just one of hundreds of stock market trading strategies we have developed since we started this blog in 2012. A lot them are free, but some are behind paywall which you only can access as a member.
Let’s dive in and explain the trading strategy, trading rules, backtest, and results.
Bottom timing – explanation
Typically, economic indicators such as GDP, inflation, and unemployment are lagging indicators, while the financial markets are forward-looking.
Because markets are forward-looking, it might be smarter to wait for a conformation of the bottom instead of nailing the exact bottom (which is almost impossible).
Instead, by waiting for an N-month period after the official start of a recession, you may be aiming to enter the market when the worst economic conditions have already been priced in. You might not nail the bottom, but you’ll be close.
However, there is only one way to know for sure, and that is by backtesting – like we always do.
Bottom timing trading strategy – trading rules
The trading rules of the strategy are simple:
[am4show have=’p2;p3;p58;p59;p130;p138;’ user_error=’Premium Post Access’ guest_error=’Premium Posts’]
- We buy the S&P 500 nine months after the start of an official recession.
- By official recession we mean two consecutive quarters of negative GDP growth.
[/am4show]
The trading rules are 100% quantified, and thus relatively easy to backtest:
Bottom timing trading strategy – backtest
We backtest the strategy on S&P 500, but we assume it can work on other stock indices as well.
Our backtest is not adjusted for dividends.
Here is the S&P 500 level and trading signals in a chart from 1940 until today:
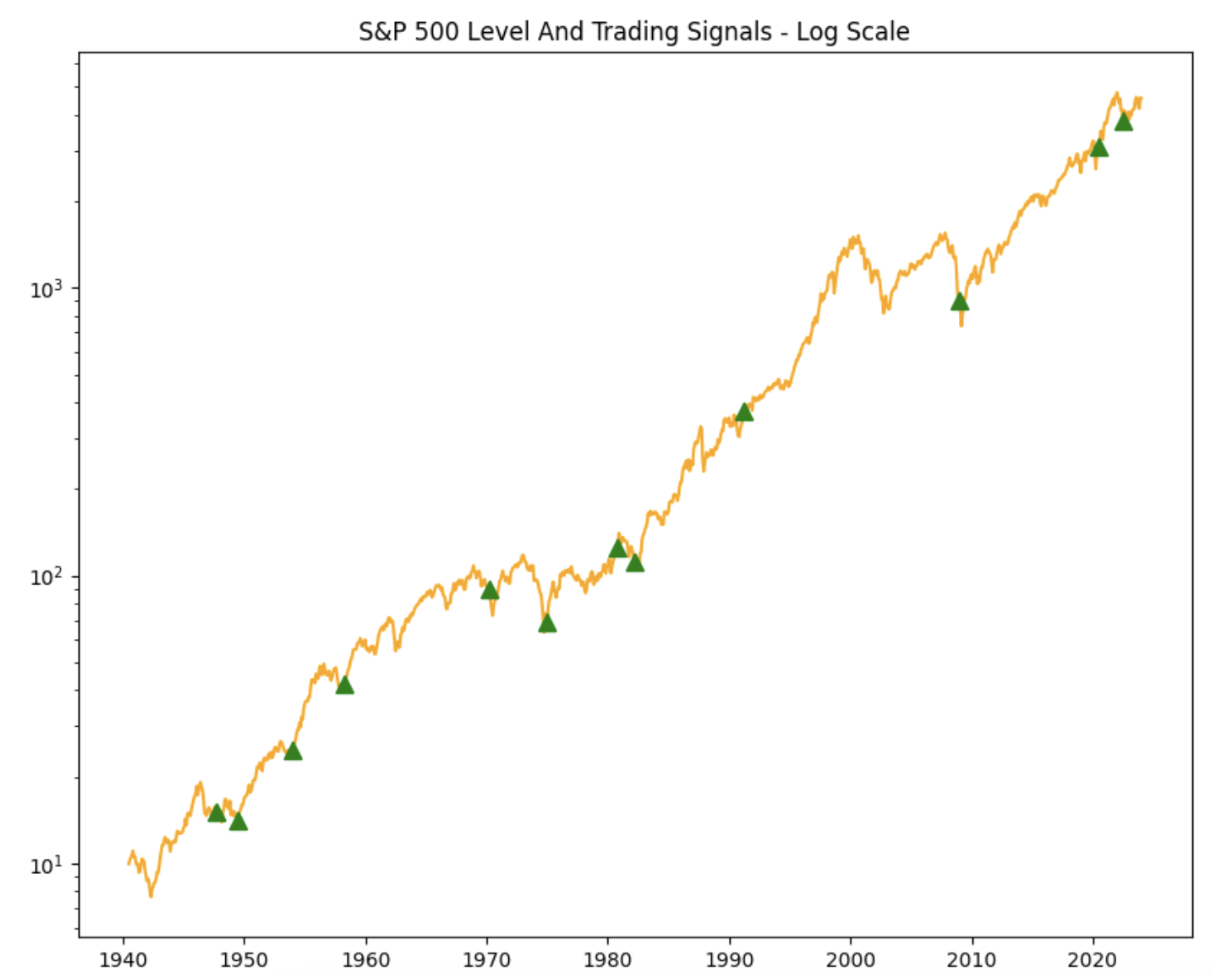
As you can see, the strategy seems to generate signals near the bottoms of a recession and it seems like stocks rally afterwards.
But what does the data say? Visual inspections might be fooling us, so let’s look at the evidence, facts, and statistics from the backtest.
Here is the performance evaluation one, three, six, nine, and twelve months after the trading signal was triggered:
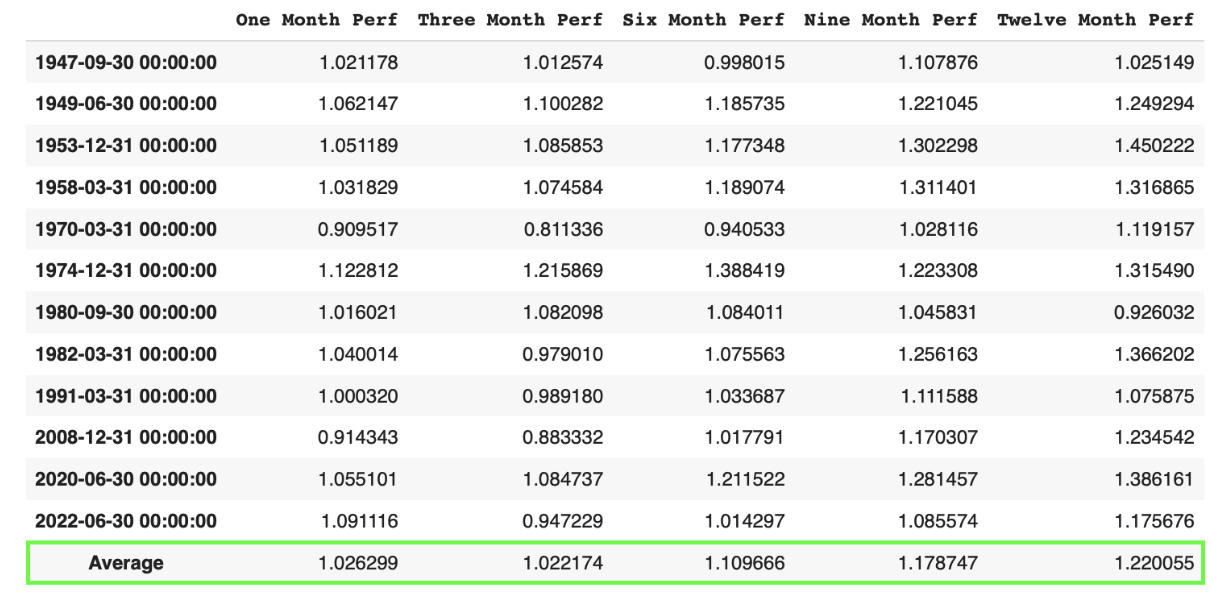
It’s not many trading signals, but it triggered positive returns on average for all the periods backtested.
On average, one year after the signal is generated the S&P 500 is up 22%, which is more than three times the return any random year. Excluding dividends, the market has risen about 6-7% annually, but 9.9% if we include reinvested dividends. Please check out the historical returns for the main asset classes.
Bottom timing trading strategy – conclusion
In conclusion, today we showed you a trading signal to try bottom timing the stock market in a recession.
The results were very good, as the strategy, on average, generated positive returns in all the subsequent periods tested.
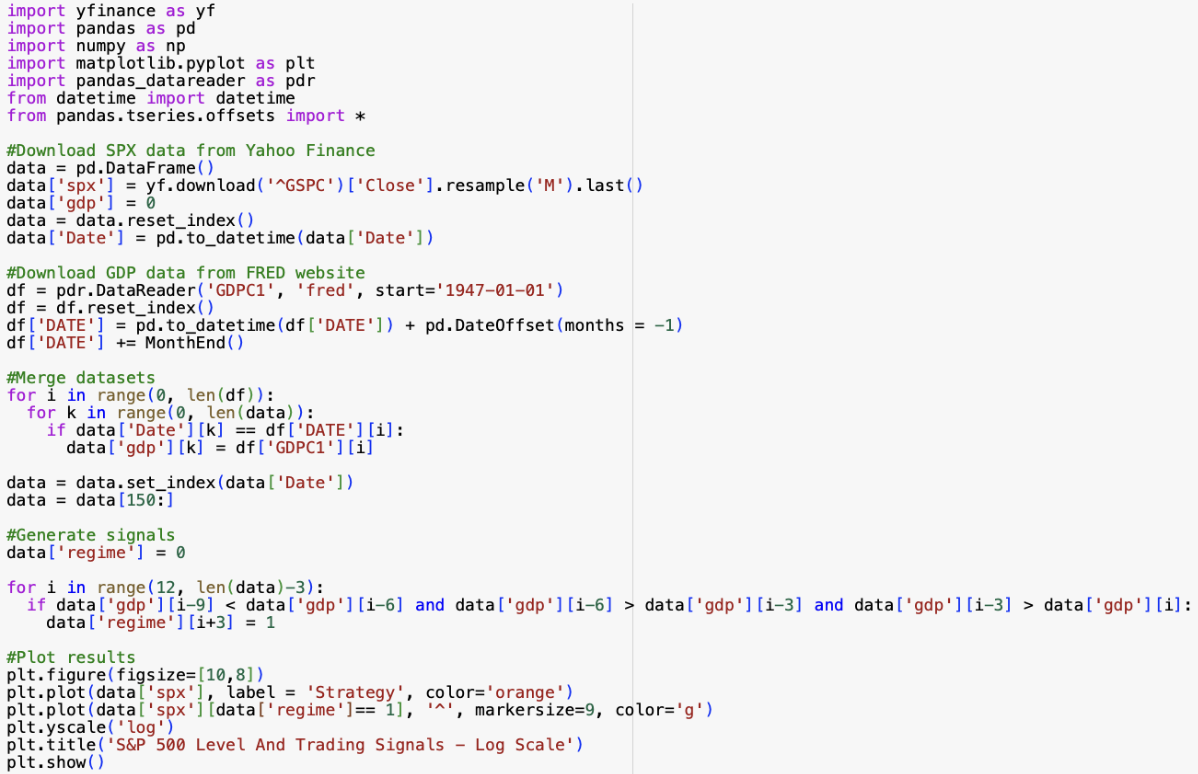
Bottom timing trading strategy – Python code
Here is the code with complete Python code: