
Bullish Engulfing Candlestick Pattern: Backtest Analysis
The Japanese candlestick chart is very popular among traders not just because it is easy to visualize but also because the candlesticks can form shapes and patterns that can give a clue about how the price might move in the future. One such pattern is the bullish engulfing pattern. What is it?
The bullish engulfing pattern is a 2-candlestick pattern that forms after a downward price swing and is characterized by the second candlestick completely consuming (engulfing) the first candlestick of the pattern. As the name indicates, it is a bullish reversal pattern that signals a potential beginning of an upward swing.

In this post, we answer some questions about the bullish engulfing pattern and strategy.
What is a Bullish Engulfing Candlestick?
The bullish engulfing pattern is a 2-candlestick pattern that forms after a downward price swing and is characterized by the second candlestick completely consuming (engulfing) the first candlestick of the pattern. As the name indicates, it is a bullish reversal pattern that signals a potential beginning of an upward swing.
The pattern consists of two candlesticks:
- The first candlestick is bearish (red or black or whatever color for a bearish candlestick), in line with the downward swing preceding it
- The second candlestick is bullish (green or white, or whatever denotes bullish candlesticks) and bigger than the first one; it engulfs the first one, indicating a potential reversal in the price direction and momentum
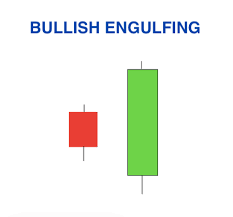
In a chart, it might look like this:
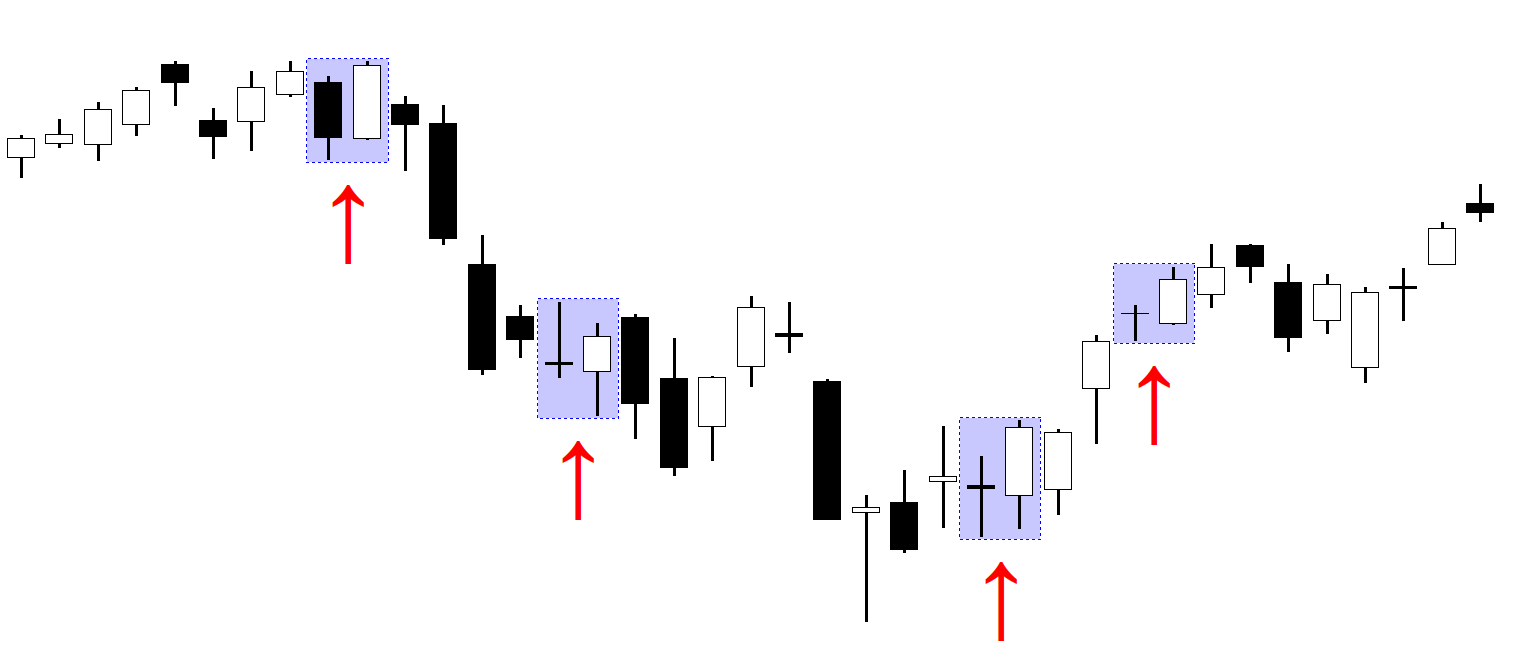
…or like this if we zoom further out:
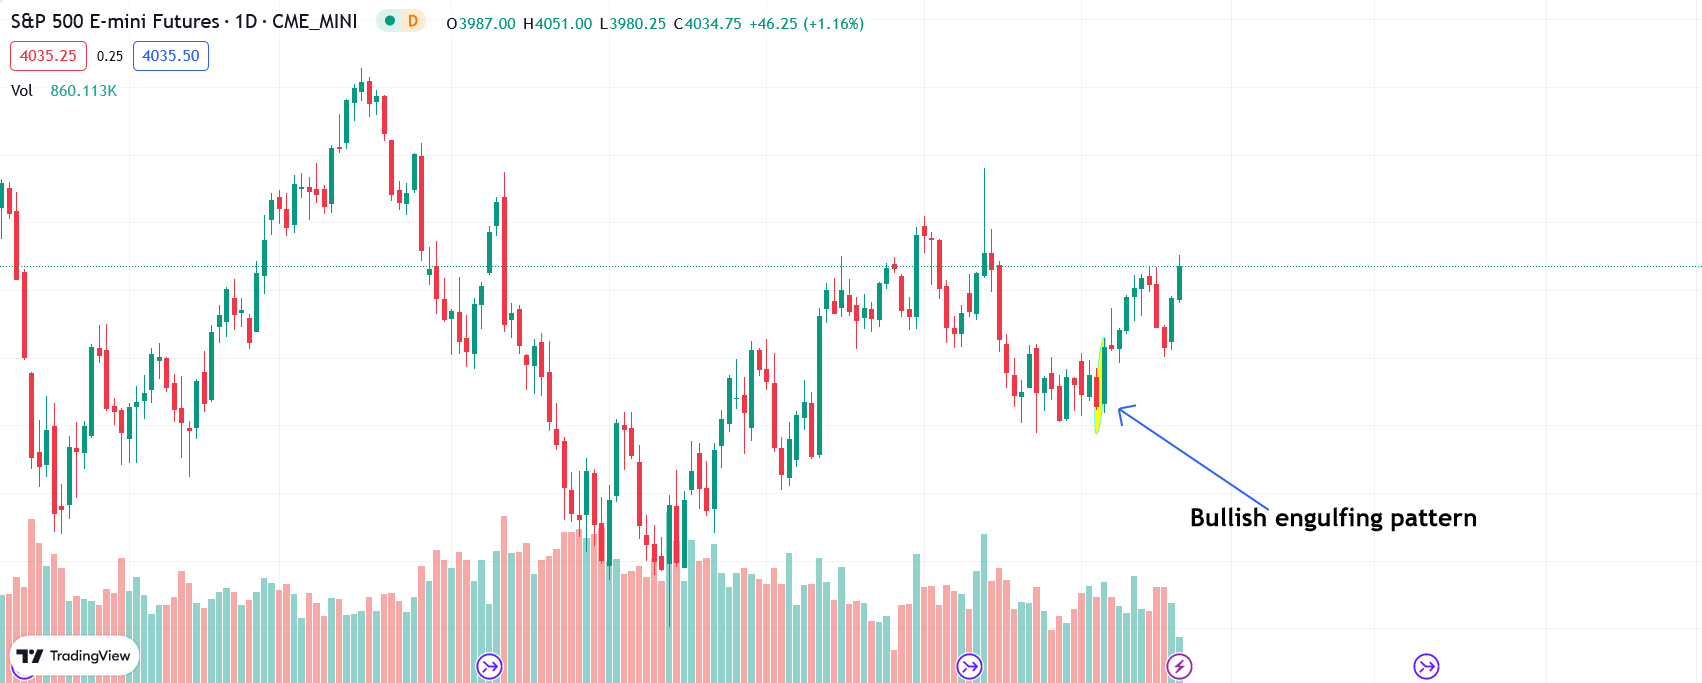
Bullish engulfing candlesticks tend to form around support levels on the price chart. They are often combined with trendlines and support levels in price action trading to trade bullish reversals after pullbacks in an uptrend. The pattern indicates that the bears were in control during the first period, but the bulls have taken control in the second period, and a bullish reversal may be imminent. It is considered a strong signal of a potential reversal, but it is more reliable when it appears after a significant pullback (61.8% Fibonacci retracement) in an uptrend.
How to Identify a Bullish Engulfing Pattern
To identify a bullish engulfing pattern, you should look for the following characteristic