
Bullish Side By Side Candlestick Pattern Backtest Results
The Japanese candlestick chart is not only easy to visualize but also makes technical analysis better, as the candlesticks can form shapes and patterns that can give a clue about how the price might move in the future. One such pattern is the bullish side-by-side pattern. What is it?
The bullish side-by-side pattern is a 3-candlestick pattern that forms in an uptrend and is characterized by two bullish candlesticks occurring next to each other after the price gaps above the first candlestick, which is also bullish. It is considered a bullish continuation pattern as the uptrend tends to continue after it is formed.
In this post, we answer some questions about the bullish Side-By-Side pattern.
What Is Bullish Side By Side?
The bullish side-by-side pattern is a 3-candlestick pattern that forms in an uptrend and is characterized by two bullish candlesticks occurring next to each other after the price gaps above the first candlestick, which is also bullish. It is considered a bullish continuation pattern as the price is likely to continue to rise after it is formed.
The pattern can be seen in any timeframe and consists of three candlesticks:
- The first candle in the pattern is typically a small bullish candle
- The second candle, which is bigger and also bullish, gaps above the first candle
- The third candle is also a bullish candle and has a similar form, length, and closing price as the second candle
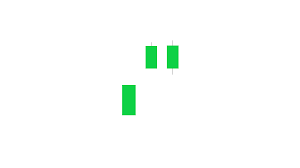
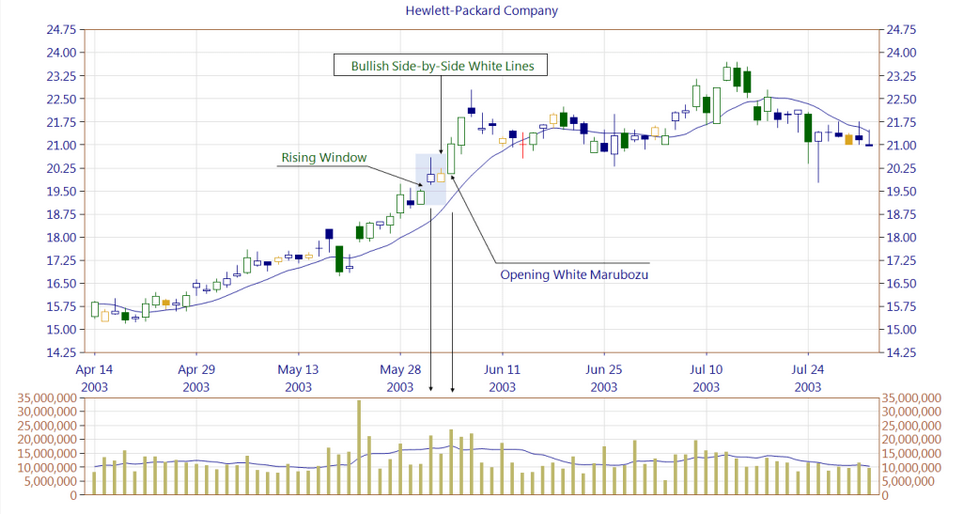
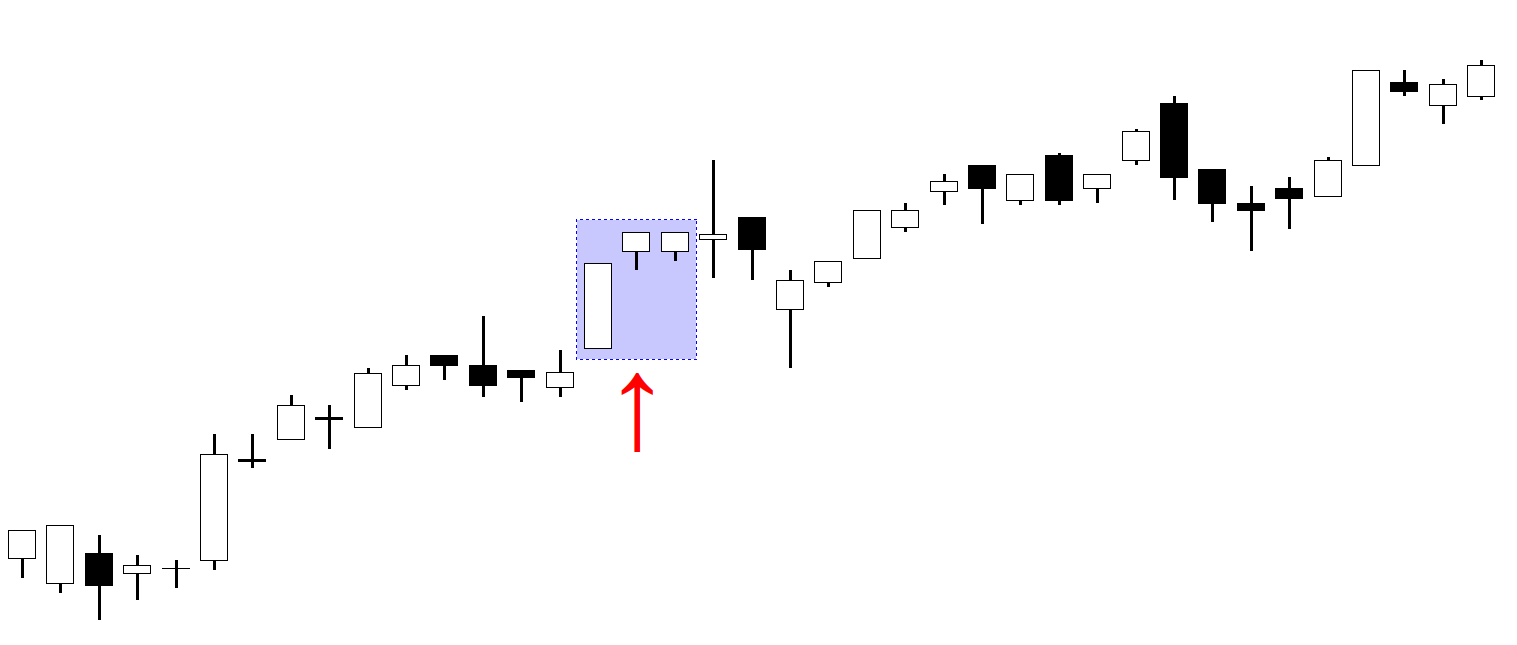
This pattern indicates that buyers are becoming increasingly confident in the market and are willing to pay higher prices to acquire the asset. Traders may use this pattern as a signal to enter a long position in the asset, with the expectation that the price will continue to rise.
Bullish Side By Side Candlestick Pattern Backtest
We recommend backtesting all your trading ideas – including candlestick patterns.
To backtest candlestick patterns, you need to set specific rules and definitions. That requires time and effort, but don’t worry: it’s already done for you!
We have defined ALL 75 candlestick patterns and put them into strict trading rules that are testable. Each single candlestick pattern is backtested and includes rules, settings, statistics, probabilities, and performance metrics.
Even better, you get the rules with Amibroker or Tradestation/Easy Language code (in addition to plain English if you like to code yourself, like putting it into a Python trading strategy, for example).
Click here to read more or order.
Benefits of Bullish Side-By-Side Candlestick
The bullish side-by-side candlestick pattern can provide several benefits for traders:
- Confirmation of bullish sentiment: The pattern indicates that buyers are becoming increasingly confident in the market and are willing to pay higher prices to acquire the asset.
- Provides a potential entry point: Traders may use this pattern as a signal to enter a long position in the asset, wit