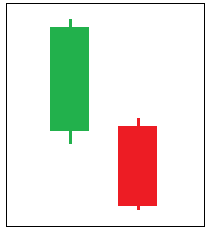
Bearish Harami Cross Candlestick Pattern Trading Strategy: (Statistics, Facts, & Historical Backtest)
The introduction of the candlestick chart in the 18th century has done a lot to simplify how we’ve come to know the once complex trading world. Now, traders from all walks of life can analyze charts in their comfortable timeframes and make sense of what’s going on in the market. Even more, they can predict…