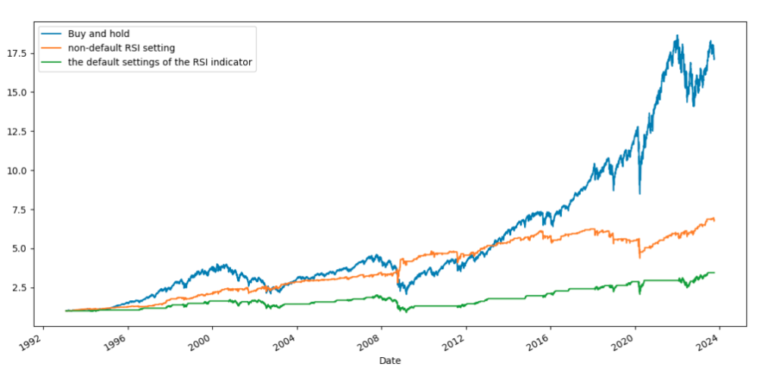
RSI 14 Debunked – Do This Instead (Statistics, Numbers, Facts)

The Relative Strength Indicator, abbreviated RSI, is probably the most popular trading indicator. It’s mentioned in almost endless posts and articles on the internet. To our knowledge, the standard default setting of 14 days is mostly used.  But does the default setting of 14 days work? Can we debunk this setting as faulty?  Let’s find…

Bitcoin MACD Trading Strategy (Performance, Backtest, Setup, Rules, Video)

Cryptocurrency trading has become increasingly popular in recent years, and Bitcoin, as the pioneer and most widely recognized digital currency, is at the forefront of this seemingly financial revolution. Traders are constantly seeking strategies to capitalize on the volatility of Bitcoin’s price, and the Moving Average Convergence Divergence (MACD) is one that immediately comes up…

The Internal Bar Strength (IBS) Indicator [Trading Strategies, Rules + Video]

The Internal Bar Strength indicator (IBS) has worked remarkably well for over two decades. We can only guess why, but the stock market has been highly mean-reverting during this period, and this has, of course, given the IBS a nice tailwind. IBS is simply an indicator where you buy on weakness and sell on strength,…

Average True Range Trading Strategy (Best ATR Indicator, Settings and System) – VIDEO

Average True Range Trading Strategy (Best ATR Indicator, Settings and System) – VIDEO

The ATR indicator is useful on its own and can be used to develop an Average True Range trading strategy. The Average True Range (ATR) was developed by Welles Wilder in the 1970s. In his famous book called New Concepts in Technical Trading Systems, published in 1978, Wilder also published the RSI and the ADX…

Williams %R Trading Strategy – Williams Percent Range vs RSI (Backtest, Indicator & Systems)

Williams %R Trading Strategy – Williams Percent Range vs RSI (Backtest, Indicator & Systems)

Williams %R was developed by the famous trader and tax rebellion Larry Williams, who has given names to several technical indicators. Last week we wrote about the WilliamsVixFix indicator, and today we are explaining the Williams %R trading strategy and how to calculate and use the indicator. Williams %R does work. In this article, we…

I Backtested The Default Settings Of The RSI Indicator And Made It Better (Strategy)

I Backtested The Default Settings Of The RSI Indicator And Made It Better (Strategy)

The Relative Strength Index indicator is popular, for a reason, but in this article, I backtested the default settings of the RSI indicator, and made it better. Investments and trading is a wonderful world where large companies and small investors can participate from the comfort of their homes. You only need a device with internet…

Investors Intelligence Sentiment Index (Advisor & Strategy): Statistics, Facts And Historical Backtests!

Investors Intelligence Sentiment Index (Advisor & Strategy): Statistics, Facts And Historical Backtests!

The Investors Intelligence Index is becoming widely accepted as a means of estimating the balance between the bulls and bears. But what does it actually mean? Also known as the Advisor Sentiment, Investors Intelligence Sentiment Index is based on contrarian propositions, which suggest equity traders should act opposite to the balance of expert opinion and…

Traders Dynamic Index Trading Strategy – (Backtest, Rules, Setup, Performance)

Traders Dynamic Index Trading Strategy – (Backtest, Rules, Setup, Performance)

Trading indicators generally work best when combined rather than being used individually. However, in this case, we will introduce an indicator designed to function as a comprehensive trading system on its own: Traders Dynamic Index trading strategy. The Traders Dynamic Index is an all-inclusive indicator primarily composed of the RSI and Bollinger Bands. This raises…

CCI Trading Strategy: Statistics, Facts And Historical Backtests!

CCI Trading Strategy: Statistics, Facts And Historical Backtests!

Technical indicators help traders in timing the market, and the CCI (Commodity Channel Index is one of the indicators you can effectively use to time the momentum in the market. But what exactly is the CCI trading strategy, and what does it tell you about the market? The CCI (Commodity Channel Index) is a technical…

Put Call Ratio Trading Strategy: Statistics, Facts And Historical Backtests!

Put Call Ratio Trading Strategy: Statistics, Facts And Historical Backtests!

The Put-Call ratio is a popular sentiment indicator. Extreme readings, mostly signaling panic and climax, are often used as contrarian signals to fade the market. For example, a high put reading might signal that traders and investors are panicking and are buying downside insurance (put options act as insurance) and that a market bottom is…