
A Python CCI Trading Strategy (Backtest)
Introduction
This article will implement a trading strategy utilizing the Commodity Channel Index (CCI) indicator. It will review the underlying theory. Subsequently, it will explain the procedure in Python for implementing the trading strategy on the SPY; furthermore, it will implement the same strategy for 25 different financial instruments.
The main purpose of this article is to show how it can be done by using Python – not the strategy itself. You might want to check out all our other relevant Python trading strategies with rules.
Commodity Channel Index (CCI)
The Commodity Index Channel is a trading indicator that measures how far the price level is concerning an average price from the same financial instrument. In 1980, Donald Lambert developed this indicator to identify cyclical trends in the commodity market, but later on, its popularity spread to other types of financial assets.
CCI = \frac{{\text{{Typical Price}} - \text{{20-period SMA Typical Price}}}}{{0.15 \times \text{{Mean Absolute Deviation (Typical Price)}}}}Where:
\text{Typical Price} = \frac{\text{High} + \text{Low} + \text{Close}}{3}
The use of 0.15 ensures a value of the indicator in the range of -100 and 100 in approximately 70% to 80% of the cases. The number of periods to calculate the SMA will influence how likely the indicator will fall between -100 and 100; a higher number of periods makes it more likely to lie in that interval, while a lower number of periods makes it less likely to lie in that interval.
Python Example
Warning
This tutorial reuses and simplifies the Commodity Channel Index implementation of the ta Python package adapted for Python learners. You can go and check the original implementation and compare it with the version of this tutorial.
Importing libraries and Downloading Python Data
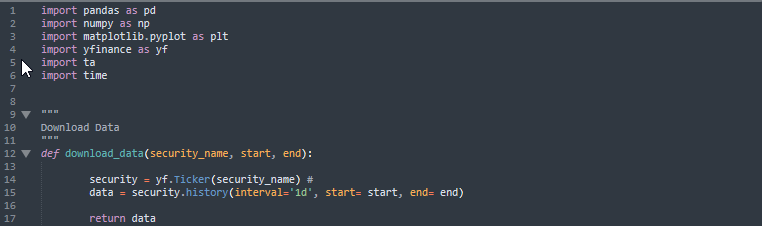
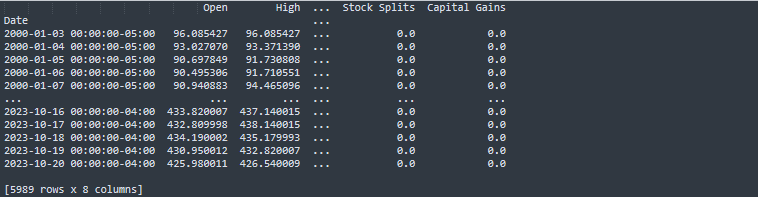
As in the previous tutorials, the first part is to import the Python libraries and download the historical financial data as follows:
The output is:
Estimation Commodity Index Strategy in Python
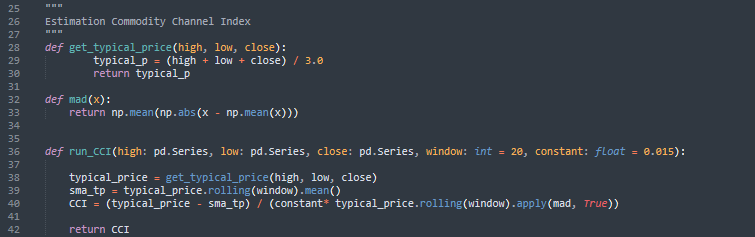
This Commodity Index Channels Python implementation will have:
1 A function to estimate the Typical Price get_typical_price
2 A function to estimate the Mean Absolute Deviation mad
3 A function to estimate the CCI run_CCI
The following image shows how to use the run_CCI function to calculate the CCI indicator; this function has five parameters: high, low, close, window, and constant. The inputs high, low, and close are all of type pd.Series; if you do not provide a pd.Series for the previous variables, Python will generate an error; this procedure prevents you from adding the wrong data types.
Meanwhile, the inputs window and constant are restricted to be integer and float, respectively. Subsequently, typical_price is the average of high, low, and close; next, sma_tp is the 20-day moving average of the typical price pandas series.
Then, putting all the pieces together, we obtain the Commodity Channel Index (CCI). It is worth mentioning that the typical_price.rolling(window).apply(mad, True) expression indicates the calculation of a 20-day Mean Absolute Deviation pandas series.
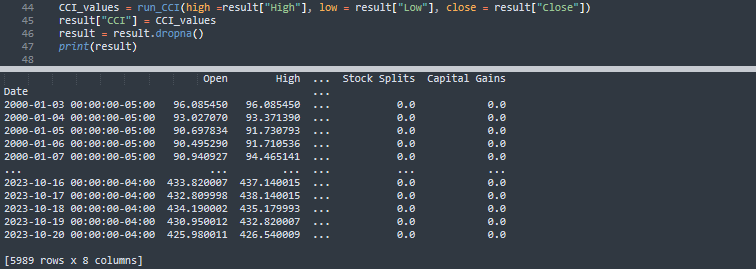
The implementation run_CCI(high =result[“High”], low = result[“Low”], close = result[“Close”]) yields:
Trading Strategy
The strategy to implement is:
- Initiate a long position when the Commodity Channel Index (CCI) is below -100, and maintain the position until the CCI crosses above 100.
- Initiate a short position when the Commodity Channel Index (CCI) is above 100, and maintain the position until the CCI crosses below 100.
The following image illustrates the signal calculation process. The calculate_signals function has one parameter CCI_values; this parameter must be a pd.Series (pandas series). In the function body, the logic is to append to the signals Python list the variable position; when CCI is lower than -100, position is one (position=1); an