

CCI Trading Strategy: Statistics, Facts And Historical Backtests!
Technical indicators help traders in timing the market, and the CCI (Commodity Channel Index is one of the indicators you can effectively use to time the momentum in the market. But what exactly is the CCI trading strategy, and what does it tell you about the market?
The CCI (Commodity Channel Index) is a technical indicator that measures the current price level of a security relative to an average price level over a given period. It is a momentum oscillator that is used to identify extreme conditions, such as oversold and overbought conditions, in the market. Its readings are relatively high when prices are far above their average and relatively low when prices are far below their average.
We start the article by explaining the theory behind the indicator, and we end the article by doing some backtesting CCI indicator.
What is CCI?
The commodity channel index (CCI) is a technical trading indicator that measures the current price level of a security relative to an average price level over a given period. It is a momentum oscillator that is used to identify extreme conditions in the market. Its readings are relatively high when prices are far above their average and relatively low when prices are far below their average. Extreme values may indicate overbought/oversold conditions in the market.
Originally, the CCI was used to trade commodities, but over the years it has been adopted to trade every kind of financial security including stocks and ETFs. The commodity channel index forecasts when a market cyclical reversal is likely. One of the fundamental theories of the CCI is that market moves in cycles, with peaks and troughs coming at time intervals.
One of the fundamental theories of the CCI is that market moves in cycles, with peaks and troughs coming at time intervals.
The CCI oscillates above and below the zero point. Below is a chart that shows how a 10-day CCI oscillates up and down:
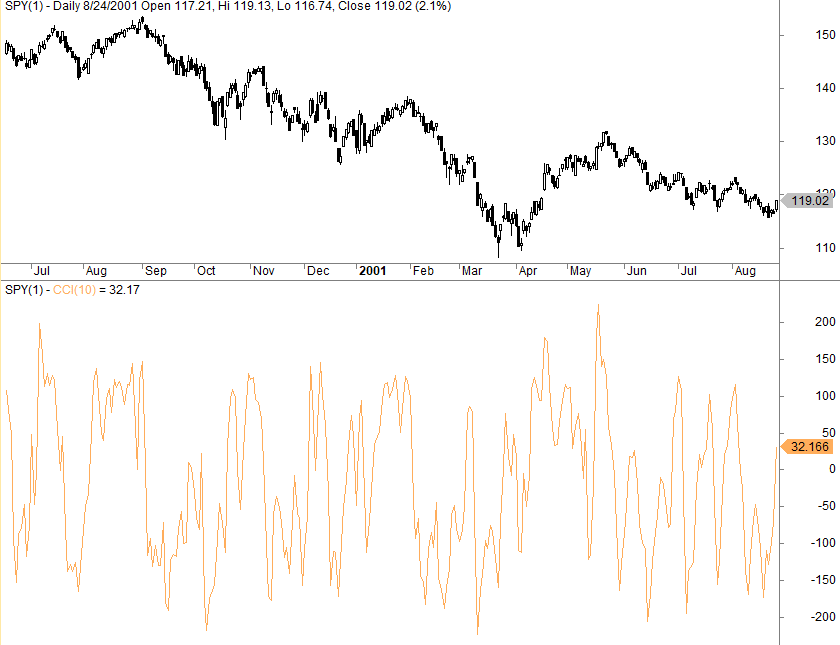
When the commodity channel index moves from a positive or near-zero region to below -100 that may be telling you that a new downtrend is underway. When that happens, you can wait for a retracement in price followed by a downward movement of both price and the CCI to signal a selling opportunity (according to the original theory behind the indicator).
The same method applies to a new uptrend. When the indicator goes from a negative or near-zero region that may indicate the emergence of a new rally. At this point, you may want to get out of any short position and look for buying opportunities.
Generally, CCI is said to be overbought when it moves above +100 and oversold when it moves below -100. However, the CCI reading of oversold/overbought levels in the market is unbound. This is so because different security behaves differently from one another.
As a trader, you have to look at a security’s historical reading on the CCI to get a glimpse of where the price reversed. For instance, the SPX (S&P 500) may tend to reverse at the +150/-180 region whereas the NDX (Nasdaq 100) may tend to reverse at the +200/-130 region. You may want to zoom out on your chart to see reversal points and the reading of the CCI at those points.
Besides oversold/overbought levels in the market, the CCI sometimes shows divergence with price. This is when the indicator is moving in the opposite direction to the price. When the indicator is rising and the price is falling, it may indicate the weakening of the downtrend. But if the indicator is falling with rising price, the uptrend is losing momentum and a reve