
Donchian Channels Trading Strategy – Trading Guide and Effectiveness (Backtest Commodities And S&P 500)
What are the Donchian Channels and do they work on stocks? The Donchian Channels were invented by Richard Donchian decades ago. They are still a popular tool for traders, but the markets have changed a lot since Donchian’s invention.
The Donchian Channels (or bands) are formed by two bands: an upper band based on the high of the last N bars, and one lower band based on the low of the last N bars. Donchian Channels work well as a trend following indicator for commodities and currencies, but not for stocks. However, we turned the Donchian Channels upside down and made the Donchian Channels work as a mean reversion indicator for stocks.
In this article we cover the following:
Donchian Channels – what is it?
Donchian is the last name of its inventor – Richard Donchian (the “father” of trend following). He was born in 1905 and is regarded as a pioneer in quantitative analysis (please also read our take on other influential quantitative traders like Ed Seykota, Edward Thorp, and Victor Niederhoffer). One of his indicators was named after him and is still very popular to this day: the Donchian Channels. To our knowledge he never wrote any book about investing but had a newsletter where he touched upon many things, among them the Donchian Channel indicator.
A Donchian Channels system is easy to calculate:
- The upper band is simply the high of the last N bars
- The lower band is simply the low of the last N bars
As you can see, it’s a pretty easy formula!
Some are also using a third band: the average of the upper and lower bands. But in this article, we skip the middle band and use only the upper and lower bands.
To give you an example of what the Donchian Channels look like, we show you a screenshot of the bands in the S&P 500 (SPY) using a 20-bar lookback period for both bands:
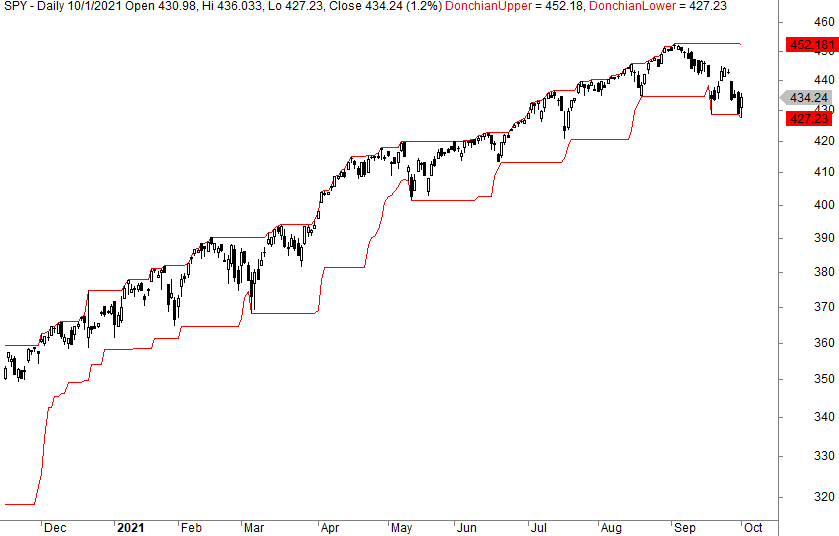
The bands follow the 20-day high and low. As the 20-day lookback period changes, you can see that the bands change values. If the price goes up, the band rises but goes sideways after a drawdown until the last high gets lower and the band drops.
This is the math behind the channels or bands. A lot of things work in theory, but does it work in practice and real life? Can we make money on Donchian Channels? The idea behind the channels was to buy a breakout to the outside and sell a breakout to the downside, or some variations of this.
A lot has changed in the security business since Richard Donchian made the Donchian Channels. Do the Donchian Channels still work?
Do Donchian Channels still work?
When Richard Donchian made the indicator, the markets were much slower and most likely trended much more than today. The Donchian Channels were invented when the personal computer was still unknown and it required some time and effort to perform the calculations. Today all trading software includes the Donchian Channels and it takes no effort to do the calculations.
Donchian Channels are mostly used as a trend-following indicator.
Richard Dennis and his famous Turtle experiment in the 1980s also used a variation of the Donchian Channels (Donchian Channels turtle trading). But the advent of the internet and computer power have changed the markets drastically and markets are less trending and faster today. This is especially true for stocks.
It’s also worth noting that Richard Donchian used the bands for long-term investing. If you do scalping, we believe you’ll fail using Donchian Channels.
How to trade Donchian Channels
Before we go on to test Donchian Channels on stocks, we would like to mention the backtesting results done in Curtis Faith’s The Way Of The Turtle. In chapter ten he tested two different variations of Donchian Channels (there are many books that touch upon the strategy). Curtis made the following trading rules:
- A Donchian Trend system that uses a 20-day breakout for entry and a 10-day breakout for exits. However, he used two moving averages , 350 and 15 days, requiring the short average to be above the long one to take a long trade. If the 25-day moving average is below the 350-day average, only shorts may be taken.
- Donchian Trend with time exit that uses the same entry criteria as above, but exits after 80 days. Read more about exits in our article called how and when should you exit a trade.
Please keep in mind that Curtis Faith tested from 1996 until 2007 and only on currencies, commodities, and Treasuries. Stocks were not included!
What was the result? Strategy number one returned a CAGR of 29.4% while strategy number 2 had a whopping 57.2% annual return. That was pretty impressive results but during a relatively short time span.
Can we expect the Donchian Channels to work today? And can we expect it to work on stocks? Let’s run some backtests and dig a little deeper.
Donchian Channels as a trend indicator
Let’s test a simple Donchian Channel strategy on the S&P 500. We test the following strategy: