
Double Death Cross Trading Strategy: Backtest And Example
The name may sound freaky, but it is a common strategy used by traders in different markets. You may be wondering what death cross and double death cross mean.
The double death cross strategy is a modified death cross where a short-period moving average (50-MA) crosses below two different long-period moving averages (100-MA and 200-MA). Unlike in the death cross where the short-period moving average crosses below one long-period moving average, in the double death cross, it crosses below two long-period MAs.
In this post, we take a look at the double death cross strategy and we make a backtest of it.
What is a death cross?
The death cross strategy is a moving average crossover that is believed to indicate the transition from a bull market to a bear market (please read our articles about bull market strategy and bear market strategy). Technically, a death cross means that a short-period moving average, usually the 50-day MA, crosses below a long-period moving average, usually a 200-day MA. Moving average trading strategies are popular in trading.
Although some traders believe it is a sign of a potential change in the trend direction, the death cross only tells you that, on average, the price has declined over the last 50 trading days if the crossing is done by the 50-day moving average.
Despite the dramatic name that suggests a potential disaster in the market (a market crash), market history suggests that the death cross tends to precede a near-term rebound with above-average returns. The death cross has been followed by above-average short-term returns in recent years.
In fact, its historical track record makes clear the death cross is a lagging indicator of market weakness rather than a leading one, so it tends to happen late into a market correction, which is followed by a rebound in price.
What is a double death cross?
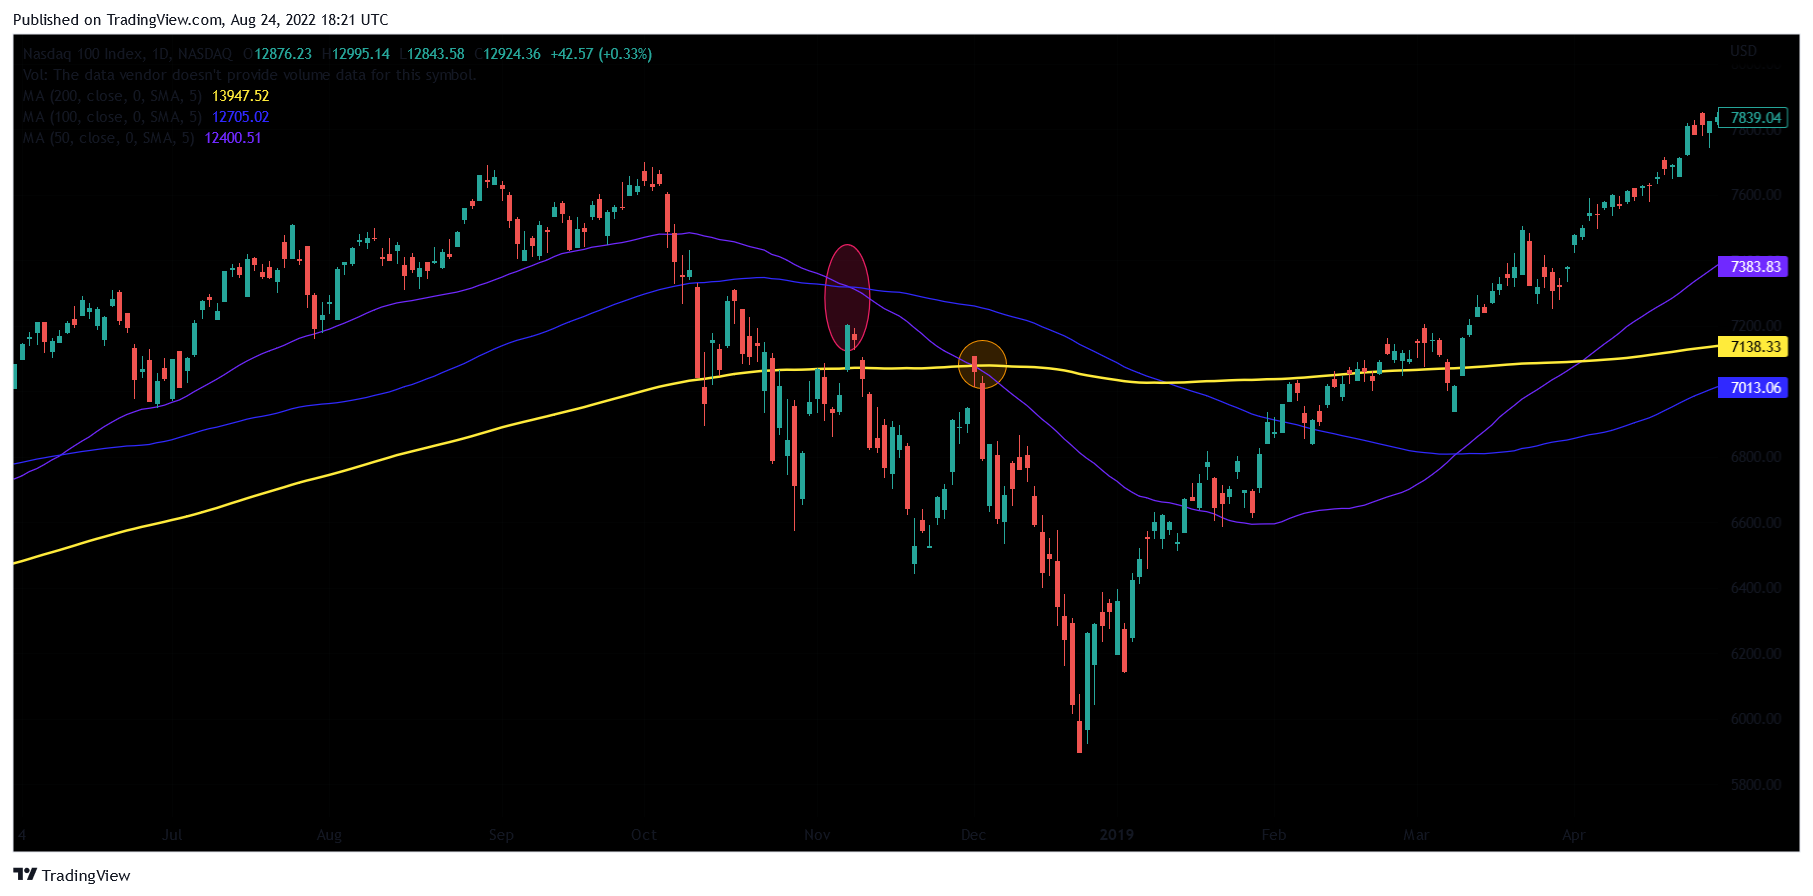
The double death cross strategy is a modified death cross where a short-period moving average (50-MA) crosses below two different long-period moving averages (100-MA and 200-MA). That is, the double death cross strategy employs one more moving average to help you anticipate when the death cross signal will occur. The third moving average is usually the 100-day MA, which is a medium-term MA situated between the other two moving averages.
So, to use the double death cross strategy, you must have the following indicators on your chart:
- 50-period simple moving average
- 100-period simple moving average
- 200-period simple moving average
A double death cross occurs when the 50-day SMA (purple line) crosses below the 100-day SMA (blue line) and then also crosses below the 200-day SMA (yellow line), as you can see in the chart below:
Is a double death cross bullish or bearish?
Some traders believe it is a bearish signal, while others believe it is only a sign of a market correction. Whichever one you want, the best thing is to backtest it to know what works best in the market you want to trade. But if you intend to trade it as a bearish signal, here is what you for example can do:
- Open an initial short position when the 50-SMA crosses below the 100-SMA
- Open a second position when the 50-SMA crosses below the 200-SMA
- Trail your profit above the 50-SMA